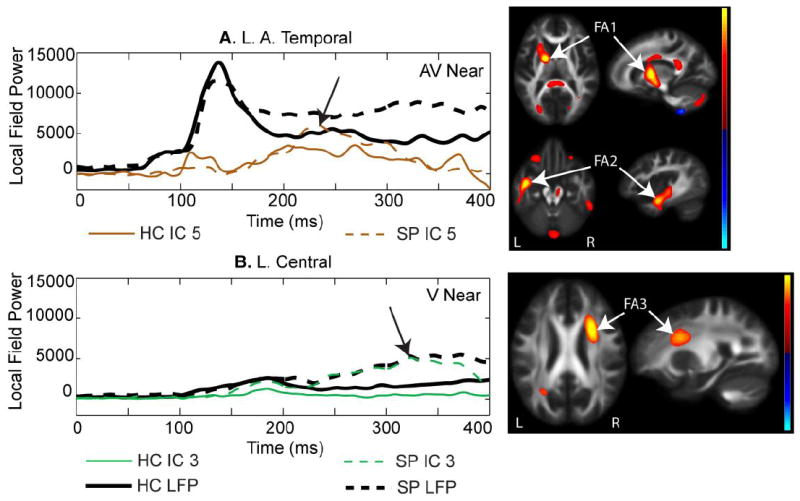
Fig. 5.

A. Temporal 200-300 ms component. This component was prominent in temporal regions similar to that shown in Fig. 4A, but this component explained a later segment of the magnetoencephalography (MEG) data (200-300 ms). This component was associated with FA increases in anterior projection fiber tracts (FA1) and association tracts in the left posterior temporal region (FA2). B. Central component. This component was prominent in bilateral MEG central LFP regions and consistently showed increased amplitude in schizophrenia patients (SP) over healthy controls (HC). This component was associated with increased FA in a right medial frontal region (FA3) with overlapping association and projection tracts.
