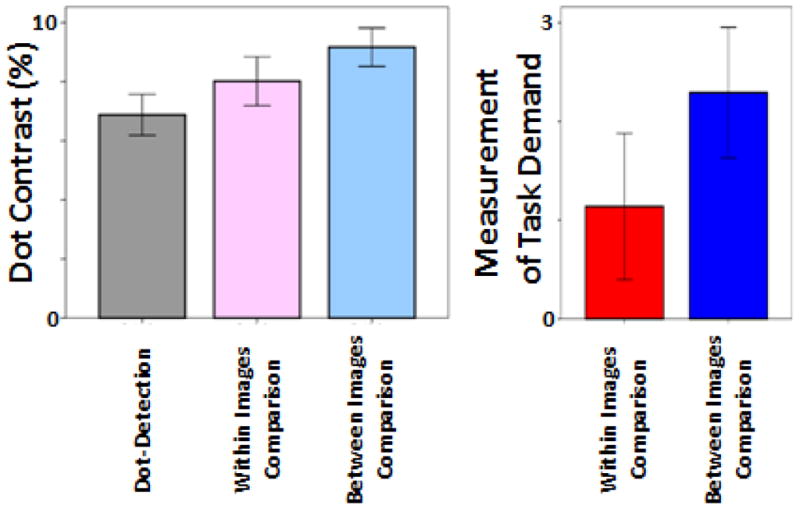
Figure 2.

Dot contrast as subjects performance converged to 75% (left). Spatial comparison demand for the two spatial comparion tasks was quantified (right) based on the difference between dot contrast level (at 75% response accuracy) for each comparion task relative to the dot-detection task (baseline). Error bars indicate one standard error.
