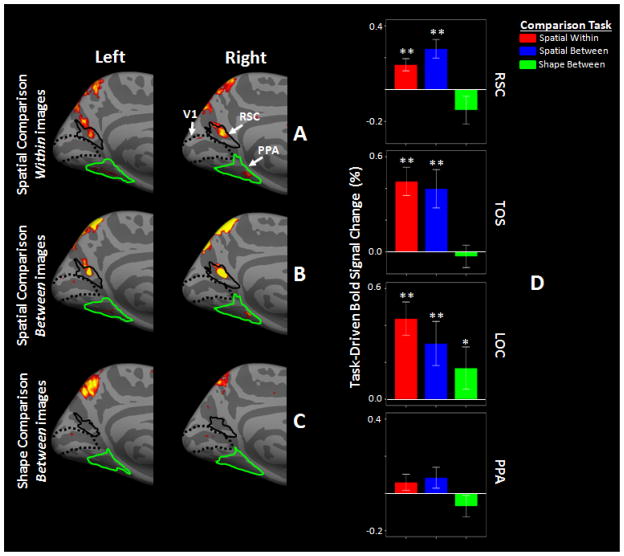
Figure 3.
Group-averaged map of task-driven activity in RSC in left and right hemispheres during comparison within (A) and between (B) images, relative to the target detection task. Panel C shows the group-averaged map of task-driven activity during shape comparison relative to the corresponding target detection task. All maps show p-values measured based on random effects. Borders of RSC (solid black) and PPA (green) were defined based on independent scans (see Methods). Dashed lines show the borders of V1, based on cytoartitectonics. Panel D shows task-driven activity measured in different ROIs during the spatial and shape comparison tasks relative to the corresponding baseline activity (*: p<0.05, **: p<0.01; t-test relative to 0). Error bars show one standard error.

