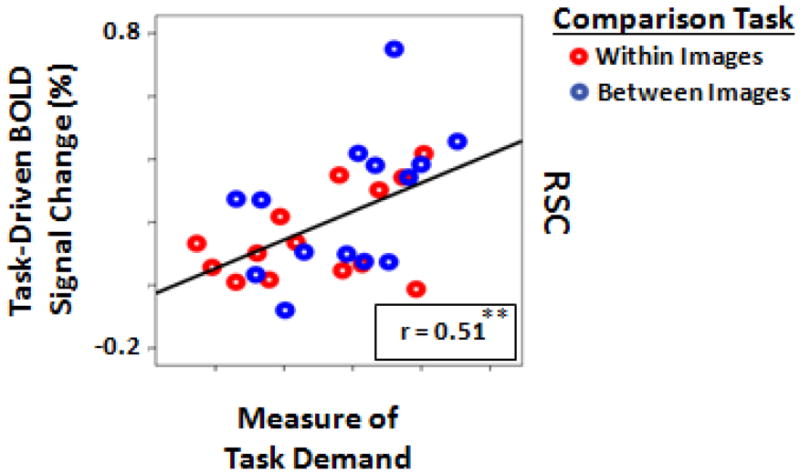
Figure 4.

The correlation between the amount of task-driven activity in RSC and the measure of task demand. Each dot represents data from one subject during comparisons within (red dots) or between (blue dots) image conditions (**: p<0.01; Pearson correlation test).
