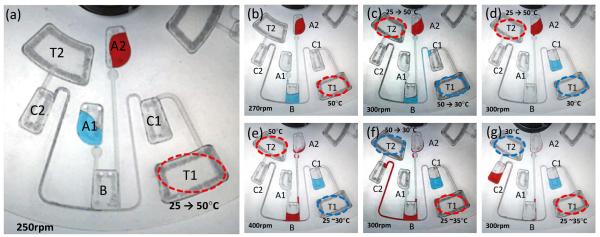
Fig. 8.
(a) Coloured liquids are individually loaded into chambers A1 and A2. The heat source is then powered ON over TP air chamber T1. (b) Blue liquid bursts from chamber A1 into chamber B. The heat source is then repositioned over TP air chamber T2. (c) Pull pumping of blue liquid from chamber B into chamber C1 in progress. (d) Pull pumping of blue liquid into chamber C1 is completed. (e) Red liquid bursts from chamber A2 into chamber B. The heat source setting is then lowered, and repositioned over TP air chamber T1. (f) Pull pumping of red liquid from chamber B into chamber C2 is in progress. (g) Pull pumping of red liquid into chamber C2 is completed. The heat source is then powered OFF. Note: circles indicate heating and cooling areas where the surface temperature is measured.

