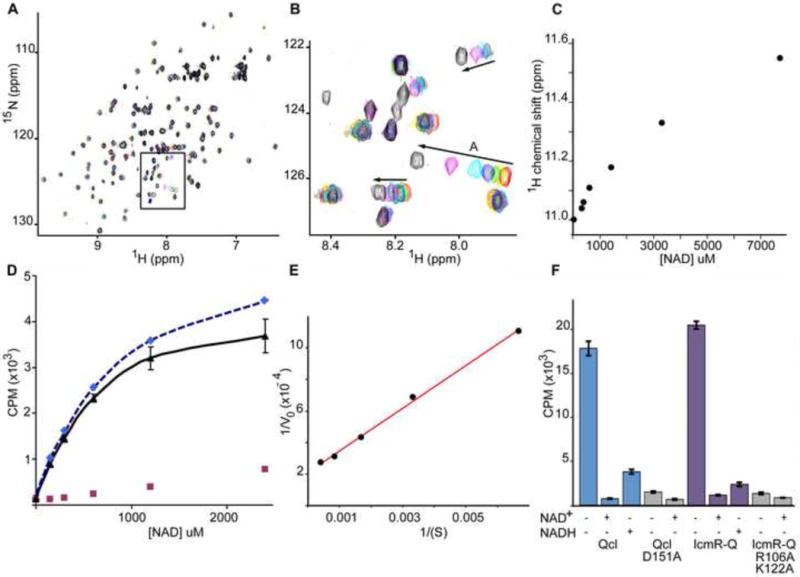
Figure 4.

NAD+ binding by IcmQ.
A. A titration of Qcl with NAD+ was monitored with 15N-HSQC spectra. The original sample contained 330 uM Qcl (red peaks). NAD+ was added to final concentrations of 330 uM (yellow), 390 uM (green), 620 uM (blue), 1.4 mM (cyan), 3.3 mM (magenta) and 7.7 mM (black). A region of interest is boxed and shown in panel B.
B. Arrows indicate the direction of peak movements in response to increasing NAD+ concentration. All spectra were acquired at 20° C in 20 mM phosphate buffer, 100 mM NaCl at pH 7.5.
C. A plot is shown of peak shifts as a function of increasing NAD+ concentration for peak A. The apparent Kd for NAD+ binding is ~ 0.5–1 mM.
D. Fitted curves are shown for 32P labeled NAD+ bound to Qcl in filter binding assays. A non-specific component (red squares) was subtracted from the raw data (dashed blue fitted line) to give the corrected binding curve (black) with a calculated Kd of ~0.38 mM.
E. A Lineweaver-Burk plot is shown for the corrected data with a Kd of ~0.64 mM.
F. A histogram is shown for NAD+ binding to wild type, mutant Qcl and double mutant IcmR-IcmQ, either alone (−/−) or in the presence of excess unlabeled NAD+ or NADH. The mutant data are shaded in grey.
