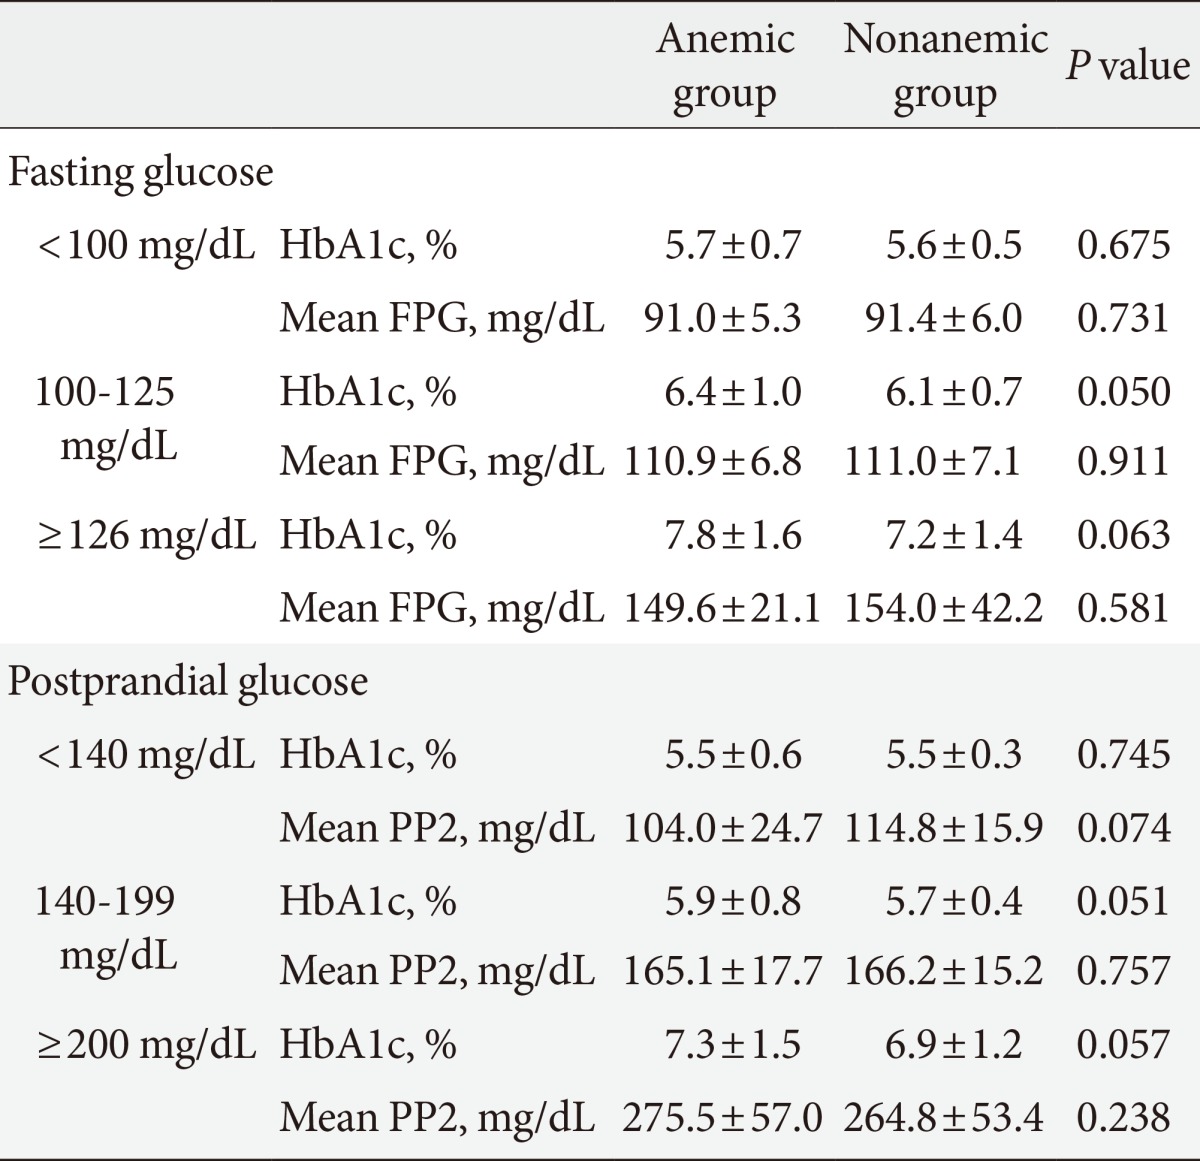
Table 3.
Comparison of mean hemoglobin A1c and mean glucose levels according to the result of fasting and postprandial glucose between anemic and nonanemic groups

Values are presented as mean±standard deviation.
FPG, fasting plasma glucose; PP2, postprandial 2-hour glucose.
