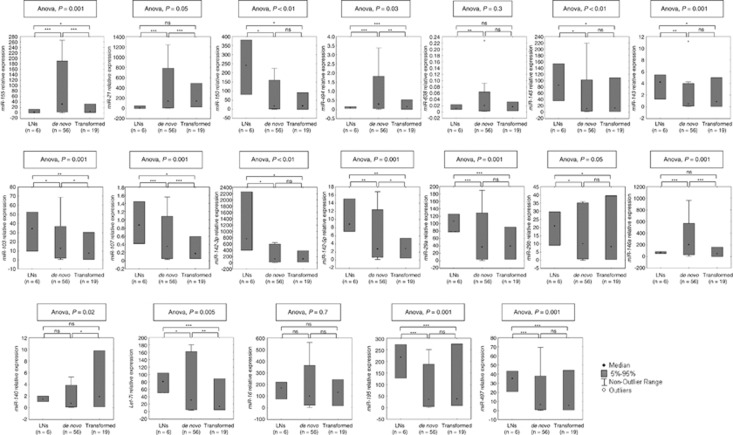
Figure 3.
Validation of differentially expressed miRNAs by RT-qPCR (cohort 1). The box plots illustrate relative expression of the respective miRNA in six LNs, 56 de novo and 19 transformed DLBCLs. One-way ANOVA and unpaired Student's t-test were used to compare expression levels among or between groups and P<0.05 was considered significant. *P<0.05; **P<0.01; ***P<0.001; ns, not significant.

