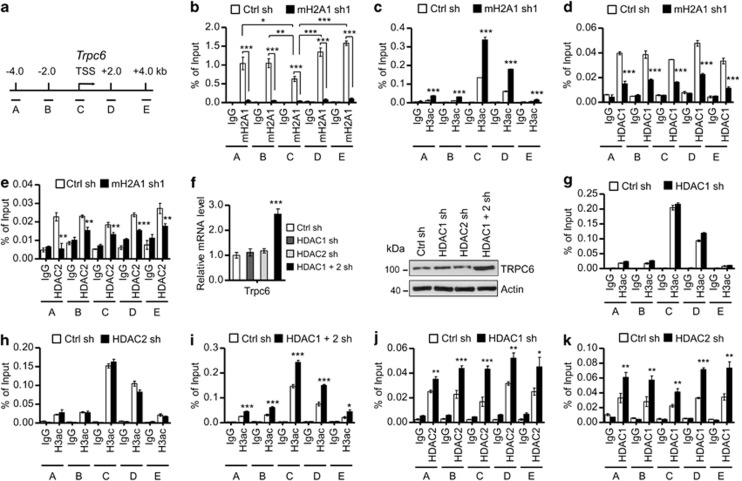
Figure 4.
MacroH2A1-dependent interplay between HDAC1 and HDAC2 in suppressing Trpc6 gene. (a) Approximate locations of five amplicons at the Trpc6 locus used in the ChIP assays are shown. (b–e) LD611 cells were depleted of macroH2A1, and ChIP experiments were performed using antibodies against macroH2A1 (b), H3ac (c), HDAC1 (d) and HDAC2 (e). Precipitation efficiencies relative to non-enriched input samples were determined for the five locations across the Trpc6 locus by qPCR with primers depicted in (a) and listed in Supplementary Table S3. (f) qRT–PCR and western blot analyses demonstrate the level of TRPC6 in LD611 cells expressing control shRNA and shRNAs targeting HDAC1 and HDAC2. (g–i) ChIP assays using an antibody recognizing H3ac were performed on samples from control cells and cells depleted of HDAC1 and/or HDAC2. (j, k) LD611 cells depleted of HDAC1 or HDAC2 were subjected to ChIP assays of Trpc6 gene using antibodies against HDAC2 (j) and HDAC1 (k). Each bar represents the mean s.d. of three replicates in two independent experiments. *P<0.05; **P<0.01; ***P<0.001.

