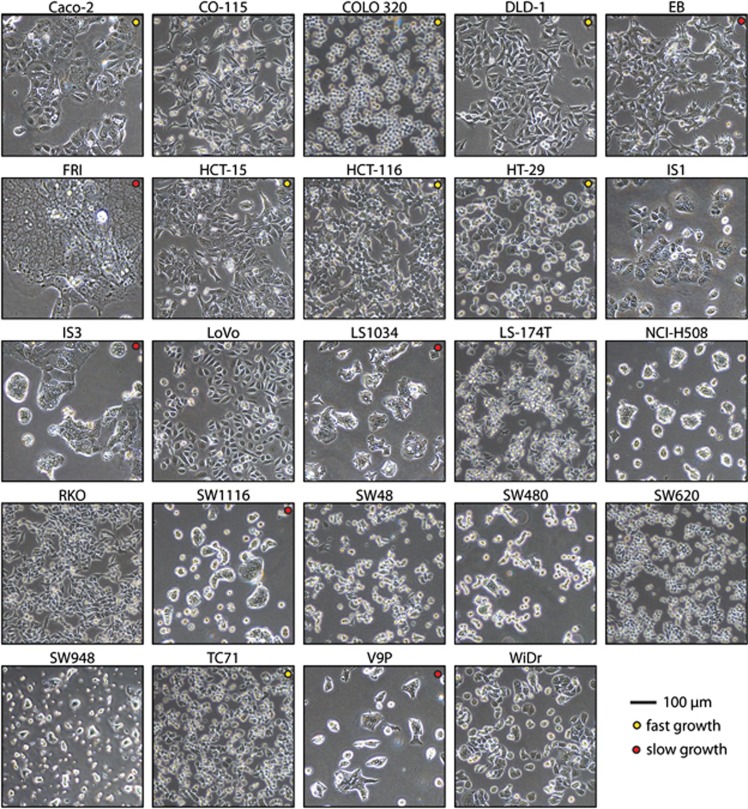
Figure 2.
Colon cancer cell lines vary in growth rate and morphology. Phase-contrast micrographs depict the individual cell cultures 24 h after trypsinization and seeding. Fast-growing cancer cell lines are indicated with a yellow dot and slower-growing cell lines are indicated by a red dot. The remaining cell lines had an intermediate growth rate. Scale bar, 100 μm.

