Figure 3.
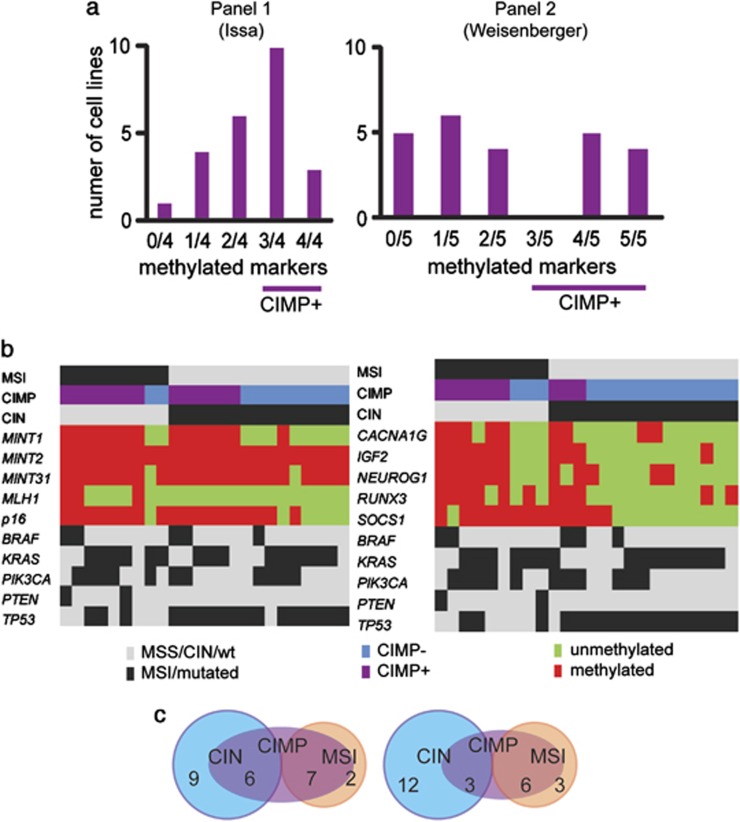
CIMP in colon cancer cell lines. (a) The status of CIMP panel 1 (Issa16 left) and panel 2 (Weisenberger et al.20 right) are illustrated. Panel 2 displayed a bimodal distribution of the number of methylated markers, identifying a distinct group of colon cancer cell lines with frequent DNA methylation. (b) Molecular profiles of colon cancer cell lines. A total of 10 markers in 2 preselected panels were tested for CIMP-related DNA methylation in 24 colon cancer cell lines. Green and red color signifies unmethylated and methylated samples, respectively. CIMP-positive samples are indicated with purple color, light blue signifies CIMP-negative samples. Samples with CIN or MSI, or BRAF, KRAS, PIK3CA, PTEN and/or TP53 mutations are marked by black color. (c) Venn diagrams illustrate the association between the three CRC phenotypes CIN, MSI and CIMP panel 1 (left) and CIMP panel 2 (right) in colon cancer cell lines.

