Figure 3.
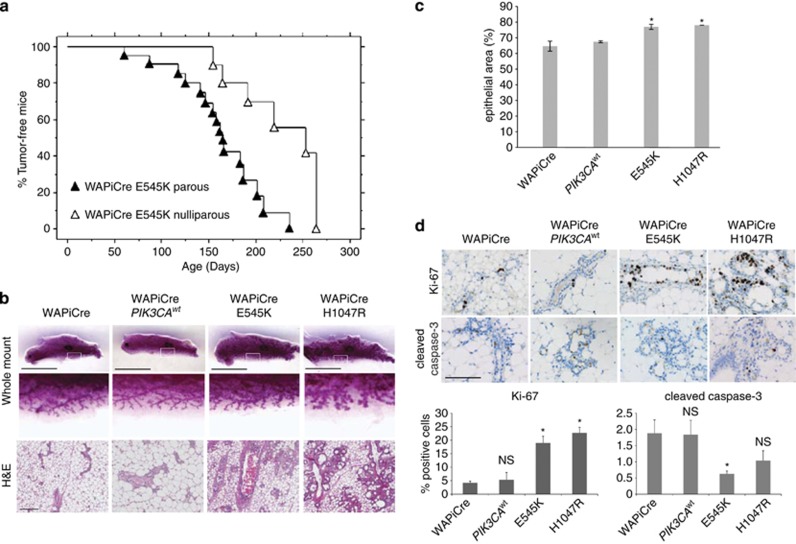
Pregnancy accelerates PIK3CA-evoked tumorigenesis and PIK3CA mutants delay mammary gland involution. (a) Kaplan–Meier curves showing tumor onset in parous WAPiCre PIK3CAE545K (n=16) and nulliparous WAPiCre PIK3CAE545K (n=6) animals. Parous WAPiCre PIK3CAE545K mice developed palpable tumors on average after 165 (±10) days whereas nulliparous mice developed tumors on average after 228 (±15) days (PIK3CAE545K); P=0.0023. (b) Representative images of whole mount (top panels), magnification of whole mount (center panels) and H&E (lower panels) staining of involuting glands from WAPiCre control, WAPiCre PIK3CAwt, WAPiCre PIK3CAE545K and WAPiCre PIK3CAH1047R mice as indicated. The glands were isolated 15 days after removal of the pups. Scale bar=1 cm (whole mounts). Scale bar=100 μm (H&E sections). (c) Bar graph showing relative epithelium to total gland area of involution at day 15 in whole mounts prepared from WAPiCre control (n=3), WAPiCre PIK3CAwt (n=4), WAPiCre PIK3CAE545K (n=4) and WAPiCre PIK3CAH1047R (n=2). Means±s.d. are shown; P=0.001 (WAPiCre vs WAPiCre PIK3CAE545K); P=0.01 (WAPiCre vs WAPiCre PIK3CAH1047R); P=0.46 (WAPiCre PIK3CAE545K vs WAPiCre PIK3CAH1047R). (d) Immunostaining for Ki67 and cleaved caspase-3 of day 15 involuting glands from WAPiCre control, WAPiCre PIK3CAE545K and WAPiCreH1047R mice (upper panels). Scale bar=50 μm. Quantification of Ki67- and cleaved caspase-3-positive cells (lower panels). Means±s.e.m. are shown. *For Ki67-positive cells: P=2.18 × 10⁻⁵ (WAPiCre vs WAPiCre PIK3CAE545K), P=2.90 × 10⁻⁷ (WAPiCre vs WAPiCre PIK3CAH1047R). For cleaved caspase-3-positive cells: P=6.55 × 10⁻³ (WAPiCre vs WAPiCre PIK3CAE545K). NS=not significant.

