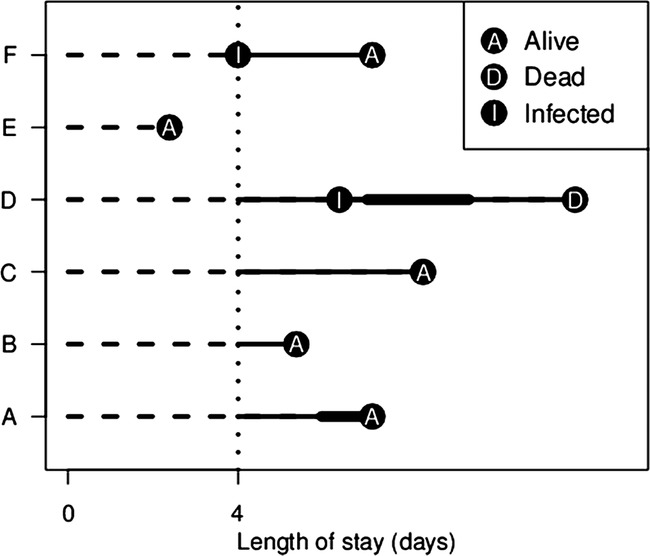
Figure 2.

Illustration of incidence density sampling for an infected case (patient E) and matched controls (patients A to C). The vertical dotted line shows the timing of infection. The dashed lines show the periods of hospital stay before infection. These times are discarded, as only times after infection are used to estimate the extra length of stay. The thicker solid lines show the time spent in the ICU. Adapted from Wolkewitz et al.10
