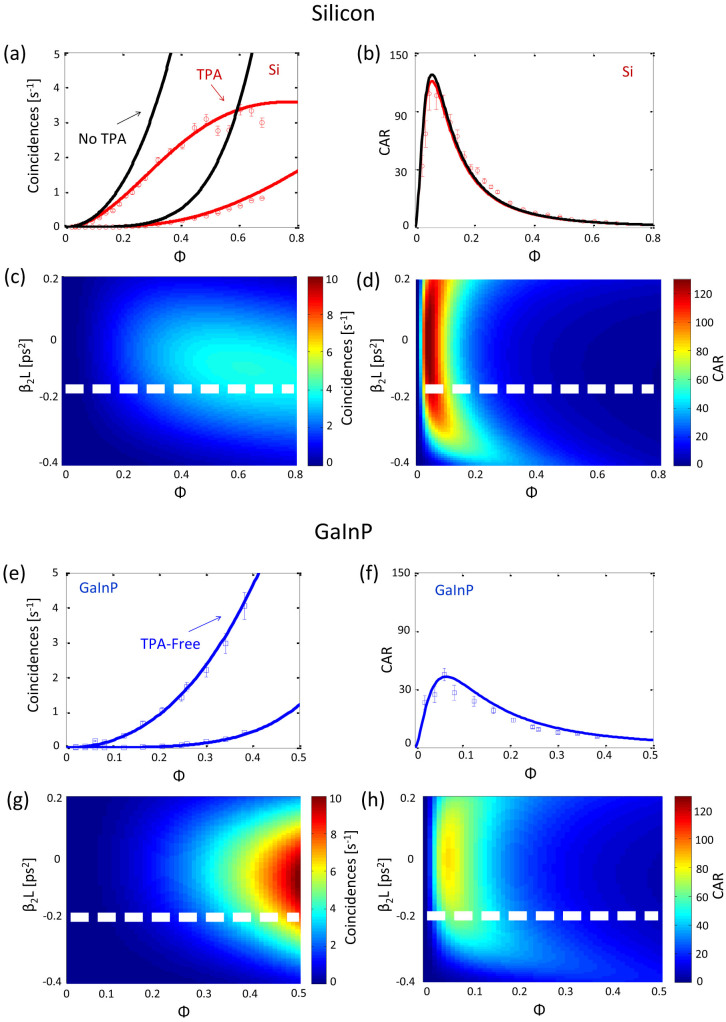
Figure 3. Evolution of coincidence counts and CAR plots with respect to nonlinear phase shift, Φ.
(a)–(d) Plots related to Si. (a) Experimental coincidence and accidental coincidence count data (circles) along with the model (solid red lines) for Si. Modelling with numerically suppressed TPA (black line) is also indicated. (b) Experimental CAR versus Φ for Si. Solid red lines are the full model while the (black lines) indicated numerically suppressed TPA. (c) Contour plots of coincidence counts and (d) CAR with respect to Φ as the GVD is varied for silicon with fixed experimental lengths. The experimental β2L is marked by the white dashed line. (e)–(h) Plots related to GaInP. The experimental data (squares) and model (lines) are as in (a)–(d). GaInP shows a quadratic increase in coincidence counts due to the lack of nonlinear absorption in GaInP in the photon pair regime. There is no black curve since there is no TPA in this case. All errors are calculated from Poissonian statistics.

