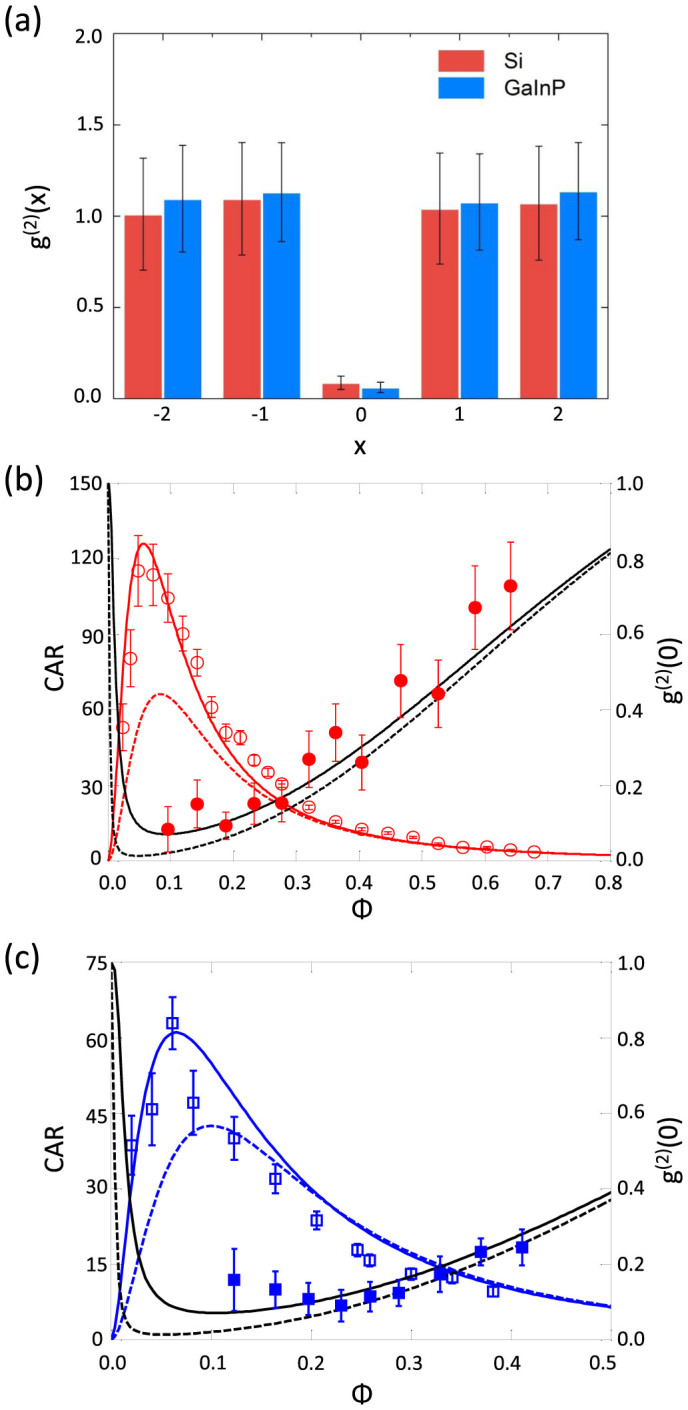
Figure 4. Second-order correlation function measurement results.

(a) Both Si and GaInP show clear non-classical results at zero delay with values of 0.09 and 0.06 respectively, recovering classical Poissonian statistics at alternative delays. (b)–(c) We plot the experimental and modelled g(2)(0) (solid symbols and black lines) in parallel with the CAR (empty symbols and red and blue lines) for Si (b) and GaInP (c) versus Φ. Dotted lines are numerical extrapolations for the g(2)(0) at the same detector settings as the CAR measurement (black dashed) and the CAR at the same detector settings as the g(2)(0) measurements (blue and red dashed).
