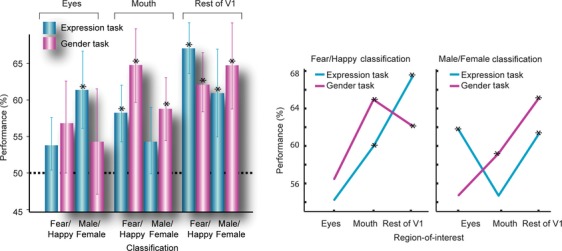
Fig. 6.

Multivariate pattern classification analysis (MVPA) shown both as a bar graph and line plot (to visualize the interaction, SEM same as bar plot, not shown). Percentage performance of MVPA classification computed on averaged data for classifying expression and gender of faces during expression and gender tasks, for the maximal number of vertices (160, see arrow in Fig. 5; asterisks reveal significance above chance of 50%, P < 0.05).
