
Figure 3.
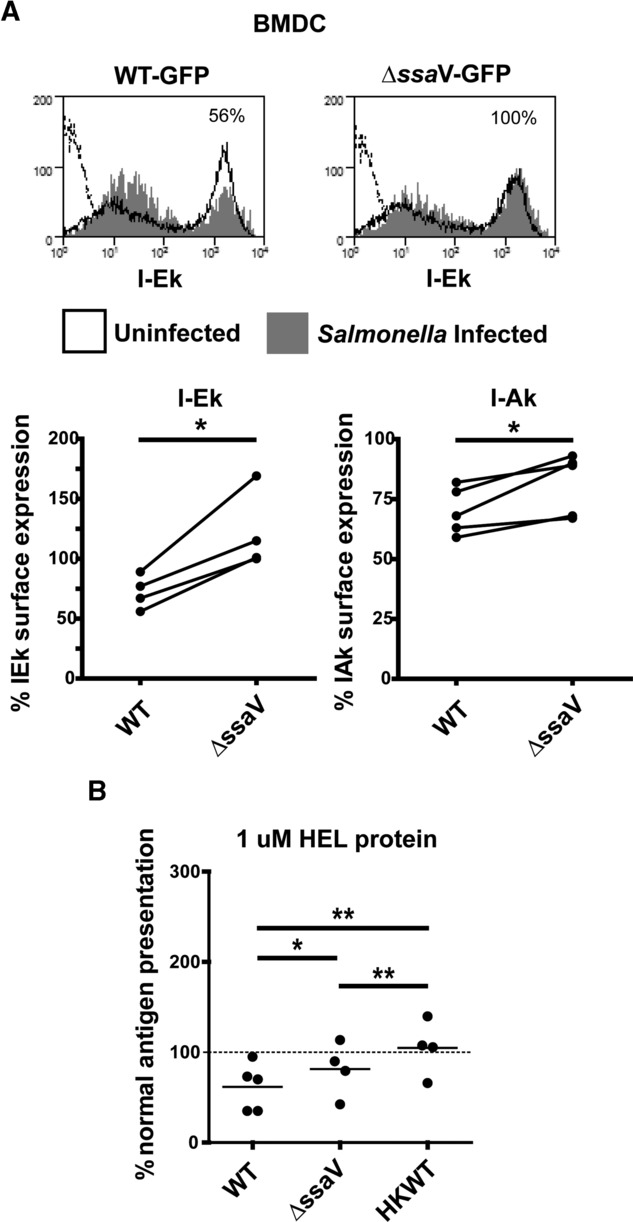
Salmonella downregulates I-A and I-E surface expression and presentation of antigen to CD4+ T cells. (A) BMDCs were infected with opsonised GFP-S. Typhimurium (MOI 10) then I-Ak (OX6) and I-Ek (14.4.4s) surface expression was compared in infected (GFP positive) and uninfected (GFP negative) CD11c/CD11b+ BMDCs by flow cytometry. Refer to Supporting Information Fig. 1A for gating strategy. Histograms (upper panels) show I-Ek surface expression in infected and uninfected BMDCs from a representative of at least four independent experiments. Graphs (lower panels) show percent of normal (GFP negative) I-Ak or I-Ek surface expression combined from four independent preparations of BMDCs infected with WT or SPI2-deficient (ΔssaV) S. Typhimurium. (B) BMDCs (in triplicate) were uninfected or infected with opsonised WT, HKWT or ΔssaV S. Typhimurium (MOI 10). From 20 h post-infection, cells were incubated with HEL protein and Type A CD4+ T hybridoma cells (3A9) at a ratio of 5 T cells: 1 BMDC. After 24 h, culture supernatants were harvested and T-cell activation was quantified by IL-2 ELISA. Graph shows percent of normal mean (uninfected) I-Ak-dependent HEL presentation to Type A T cells combined from at least four independent experiments. Antigen presentation in uninfected BMDCs is shown as a dashed line. Comparison of distributions was performed by paired two-tailed t-tests.