
Figure 8.
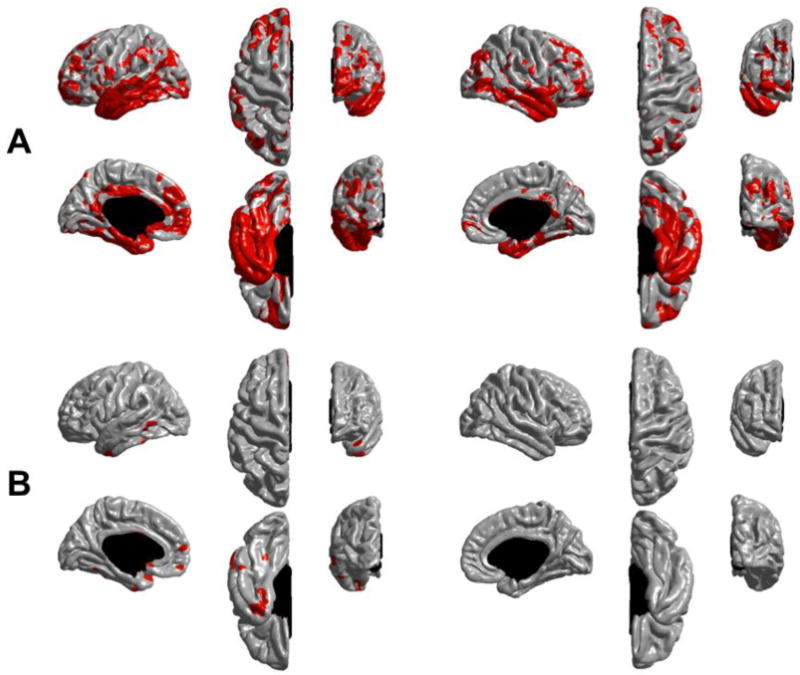
Cortical regions exhibiting a statistically significant difference in longitudinal thinning between stable and converter MCI subjects (in red). These maps were derived by thresholding the values shown in Figure 7 with an FDR correction at q=0.05. (A) ST-LME method and (B) X-Slope method. ST-LME reveals a much more dramatic extent of significant thinning differences between two groups.