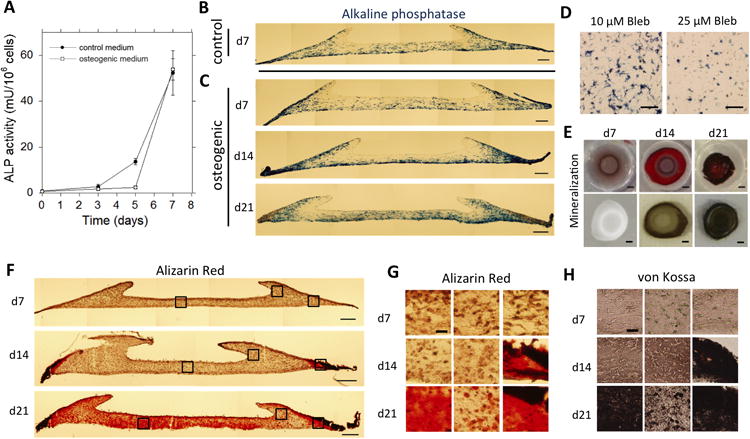
Fig. 4. Spatially regulated differentiation in contracted constructs.

(A) Time course of alkaline phosphatase activity per 106 cells retrieved from constructs cultured in either control medium or osteogenic medium. Error bars represent SD, n=3. (B,C) Color micrographs of 30μm cross sections of constructs stained for ALP (blue) after (B) 7 days in control medium, or (C) 7 days (top), 14 days (middle), and 21 days (bottom) in osteogenic medium (Scale: 200μm). (D) Color micrograph of representative areas of 200 μm cross sectionsof non-contracted constructs stained for ALP (blue) after 7 days of culture in osteogenic medium supplemented with either 10 μM (left) or 25 μM (right) Blebbistatin (Scale: 200 μm). (E) Top view photographs of whole gel constructs cultured in osteogenic medium for 7 days (left), 14 days (middle), and 21 days (right) stained for mineralized matrix with Alizarin Red (top row) or von Kossa (bottom row). The gray/brown appearance of the construct at day 7 stained with Alizarin Red is caused by non-specific background staining (Scale: 1mm).(F) Color micrographs of 30μm cross sections of constructs cultured in osteogenic medium for 7 days (top), 14 days (middle), or 21 days (bottom), stained for mineralized matrix with Alizarin Red (Scale: 200μm). (G) Higher magnification images of indicated areas in F. Alizarin Red staining of constructs cultured for 7, 14, and 21 days (Scale: 25 μm, applies to all images). (H) Color micrographs of 30 μm cross sections of constructs cultured in osteogenic medium for 7, 14, and 21 days, stained for mineralized matrix by von Kossa. The images represent areas corresponding to the indicated areas in F (Scale: 25 μm, applies to all images).
