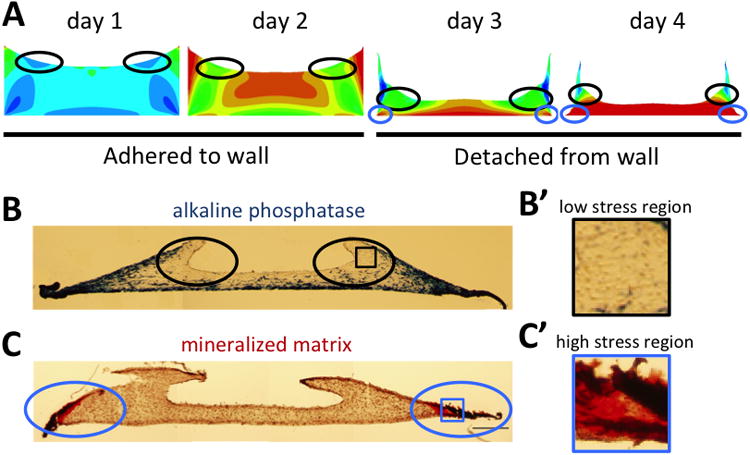
Fig. 6. Regions of low shear stress correlate with low ALP expression.

(A) Black circles indicate regions of relatively low shear stress as calculated by the FE model at different time points before and after the construct is released from the side wall. Blue circles indicate regions of high stress once the gel has contracted off the wall.(B) Regions of low ALP expression are indicated by black circles in a cross section after 14 days in culture. (B′) Magnification of the indicated area in B. (C) Blue circles indicate the formation of mineralized matrix (red) at the outer edges of the construct after 14 days in culture. (C′) Magnification of the indicated area in C.
