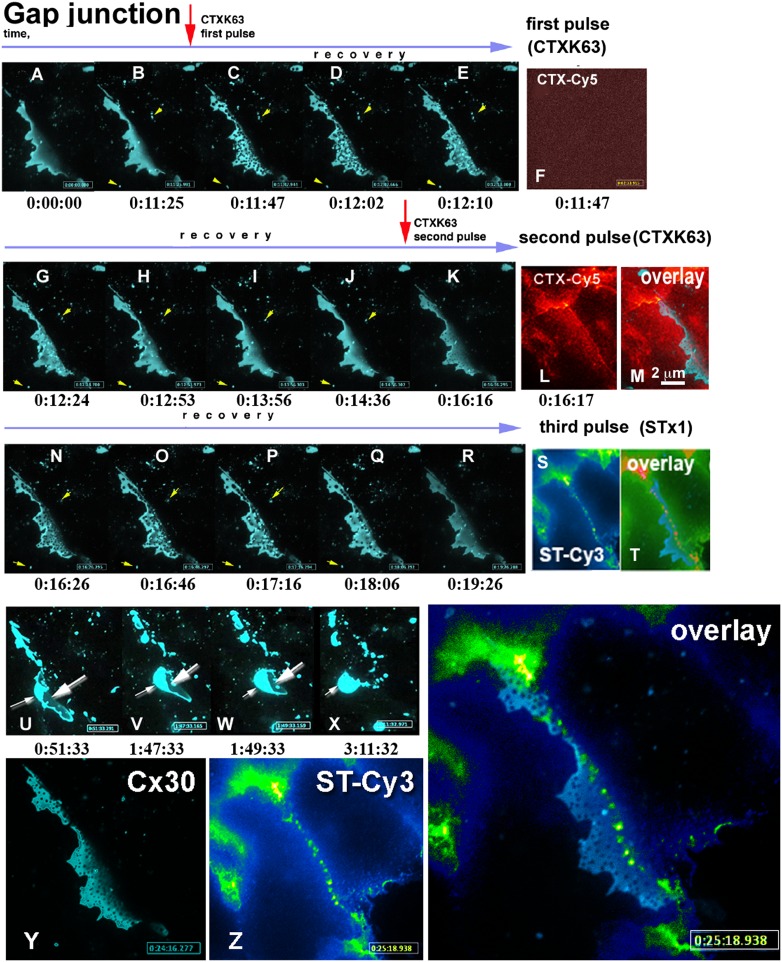
Fig. 3.
tCDRs are not formed due to the direct binding of AB5 toxins to GJ plaques, but appear as part of a generalized response of the cell membranes to stress induced by the toxins. (A–R) (blue) Fluorescence of a Cx30-CFP labeled GJ plaque over time in the same confocal z plane (the entire process can be followed in Movie S4). Red arrows indicate the times of addition of a Cy5-labeled nontoxic mutant of CTX, CTXK63. Fast appearance of tCDRs (B and C frames) was followed by comparatively slow recovery, lasting around 1 min (E–H). Cx30-CFP labeled membrane vesicles (yellow arrowheads) next to the GJ plaque remained intact, their positions stayed unchanged during tCDR formation and recovery. (Only one vesicle disappeared between H and I, presumably from the focal plane.) (F) No plasma membrane labeling with Cy5-labeled CTX was detected during the first period of tCDR formation, suggesting that few molecules of toxins are sufficient to generate a tCDR response. (L) Membrane surface fluorescence was only observed after a second application of Cy5-labeled toxin. (M) Spectrally distinct channels were selected for Cx30-CFP (λex = 434 nm) and CTX-Cy5 (λex = 647 nm) to exclude bleed-through of the fluorescence. This data confirms absence of colocalization between toxin and GJ plaque or between toxin and tCDRs that appeared inside the GJ plaque. Time is indicated below individual movie frames as hours:minutes:seconds. (K–R) The second application of (CTXK63-Cy5) to the same plaque again resulted in fast tCDR formation and slow recovery (see also SI Appendix, Fig. S6). After recovery from two pulses of CTX, wild-type STx1 toxin labeled with Cy3 (ST-Cy3) induced a third round of tCDR formation and recovery in the same GJ plaque (not shown here; see Movie S4). (S and T) As with CTXK63-Cy5, the fluorescence of Cy3-STx1 was not colocalized with tCDRs inside the Cx30-CFP–labeled GJ plaque or in the plaque itself. (T) Three-channel overlay of R and S: note that the color table was adjusted to better display that neither toxin colocalized with the Cx30-CFP fluorescence of the GJ plaque. Cx30-CFP is shown in blue; red structures represent colocalization of both toxins. (U–X) Three pulses of AB5 toxins resulting in three waves of tCDR responses induced irreversible changes in the contacting cells. Further observation of the same GJ plaque over the next 5.5 h revealed disruption of the cell–cell contact and internalization of the GJ plaque (Movie S4). [Scale bar in M (2 μm) defines sizes for all images in A–X.] (Y and Z) Higher-magnification view of the tCDR response induced in the Cx30-CFP–labeled GJ plaque. An overlay of Cx30-CFP (Y) and STx1 (Z) fluorescence is shown, demonstrating that STx1 and tCDRs do not colocalize; times are indicated. (For the complete data set and further details see Movie S4.)

