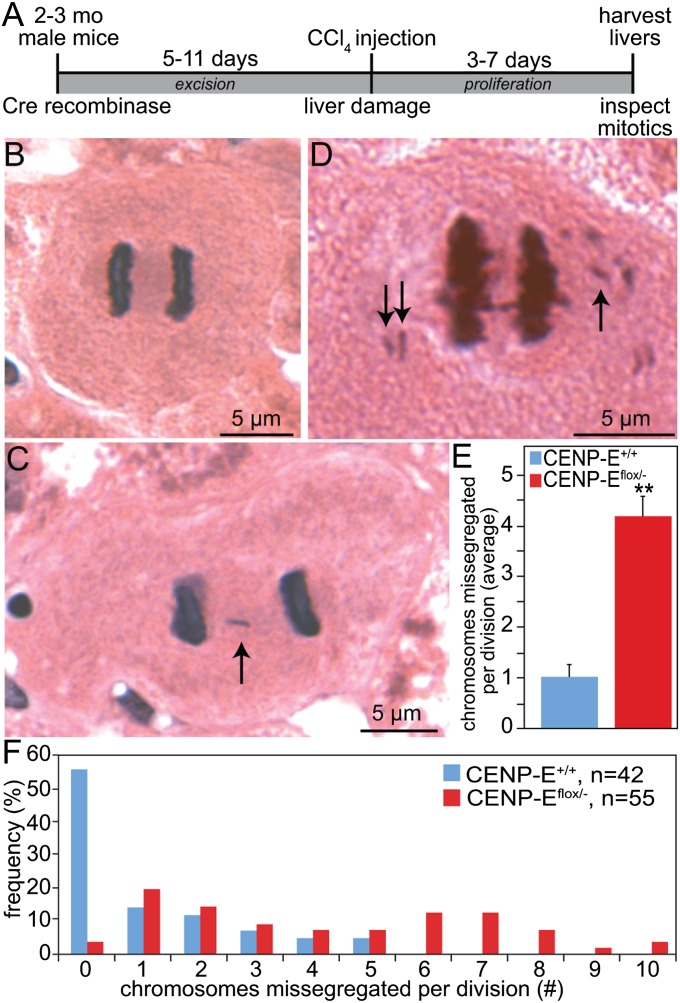
Fig. 2.
Liver cells exhibit low CIN that is increased by reduction of CENP-E. (A) Schematic of experiment to initiate proliferation in murine hepatocytes with normal and reduced levels of CENP-E by introducing an adenovirus encoding Cre recombinase into 2- to 3-mo-old mice with wild-type CENP-E (+/+) or one floxed and one null allele of CENP-E (flox/−) (11). (B–D) H&E-stained tissue sections of mitotic hepatocytes in normal anaphase (B), anaphase with lagging chromosome (arrow) (C), and anaphase with polar chromosomes (arrows) (D). (E and F) Average number (± SEM) (E) and range (F) of chromosomes not contained within the segregating masses of DNA obtained by analysis of wild-type (n = 42) and CENP-Eflox/− (n = 55) cells. **P < 0.001.

