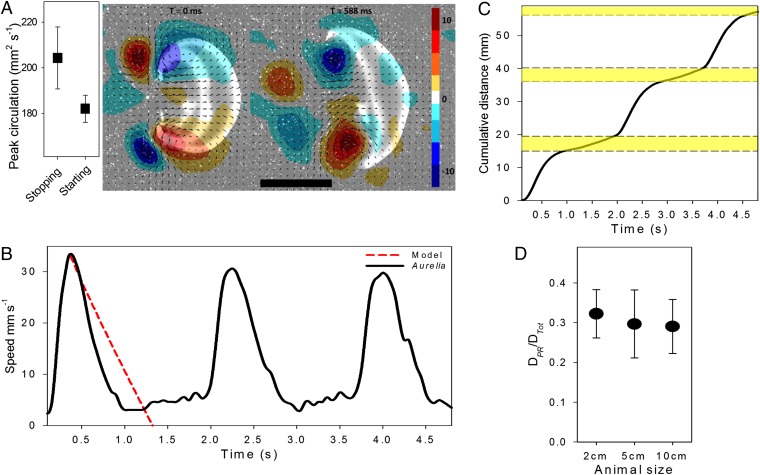
Fig. 2.
Swimming performance of A. aurita. (A) Maximum circulation and vorticity starting and stopping vortices during normal swimming (cruising). (Scale bar, 1 cm.) (B) Representative swimming sequence of a 3-cm A. aurita, showing an increase in speed during periods of no kinematic body motion (postrecovery). The model (red) shows a conservative estimate of the change in speed with time from inertia alone. (C) Cumulative distance of the jellyfish shown in B. Yellow represents the distance gained from passive energy recapture. (D) Effect of passive energy recapture with size (bell diameter). No difference (P = 0.550) is observed between body size and the relationship between distance traveled from passive energy recapture (DPR) relative to the total distance traveled per swimming stroke (DTot).

