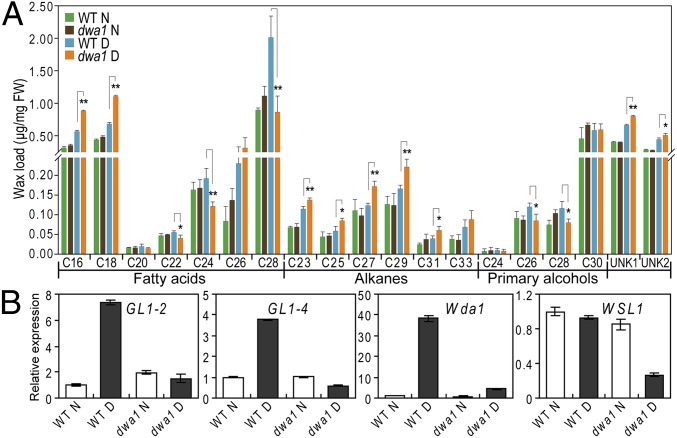
Fig. 5.
Cuticular wax composition analysis and the expression levels of wax-related rice genes in the dwa1 mutant and WT leaves under normal and drought conditions. (A) Cuticular wax composition and loads in the dwa1 mutant and WT leaves under both conditions. Error bars indicate SE of three biological repeats (t test: *P < 0.05; **P < 0.01). D, drought stress; N, normal growth; UNK, unknown metabolite. (B) Expression levels of wax-related genes in dwa1 and WT plants under drought stress.

