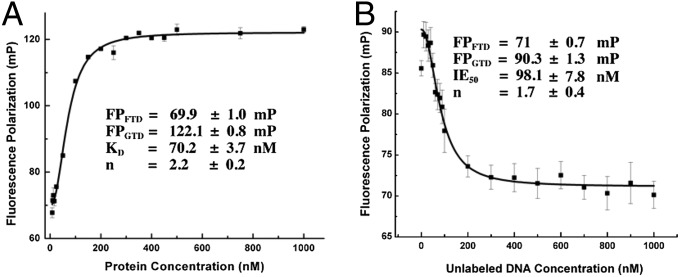
Fig. 4.
Fluorescence polarization assays to measure DNA binding by GabR. Each data point was measured in triplicate. The average values and errors were plotted and fitted to the Hill equation. The abbreviations used in the figure are as follows: FPFTD, fluorescence polarization signal of free labeled DNA; FPGTD, fluorescence polarization signal of the GabR−DNA complex; KD, the dissociation constant; n, the Hill coefficient; and IE50, the concentration of unlabeled DNA required to bind 50% of protein. (A) Titration of GabR against 50 nM TAMRA-DNA. The GabR concentrations were varied from 0 to 1,000 nM. Error bars are too small to be displayed if the errors are less than 1/1,000th of the measured value. (B) Competitive binding assay. Titration of unlabeled DNA (0–1,000 nM) against a fixed concentration of preformed GabR-labeled DNA complex (100 nM each of GabR and TAMRA-DNA).

