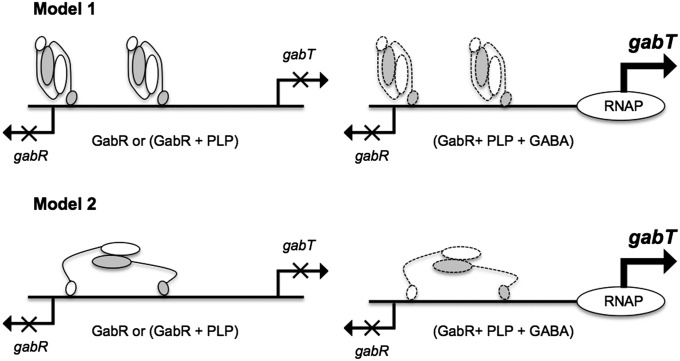
Fig. 7.
A model for transcriptional regulation at the gabR and gabT promoters. Different models for GabR binding in the gabR–gabT regulatory region are depicted. The GabR homodimer is represented as a cartoon with one monomer shown in white and the other colored gray. The larger oval represents the AT-fold domain and the smaller oval represents the winged-helix domain. Putative conformational changes in the presence of GABA are indicated by symbols with dashed lines.

