
Fig. 3.
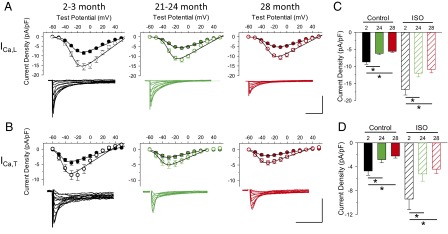
Decreased ICa,L and ICa,T conductance densities in aged SAMs. (A and B) Average (±SEM) current-voltage relationships and representative currents for ICa,L and ICa,T in SAMs in mice aged 2–3 mo (black), 21–24 mo (green), and 28 mo (red) in the absence (filled circles) and presence (open circles) of 1 μM ISO. (Scale bars: 5 pA/pF, 25 ms.) (Insets) Representative current families. (C and D) Average (±SEM) peak ICa,L and ICa,T densities in SAMs in mice aged 2–3 mo (black), 21–24 mo (green), and 28 mo (red) in the absence (filled bars) and presence (hatched bars) of ISO. *P < 0.05, one-way ANOVA with a Holm–Sidak posttest.