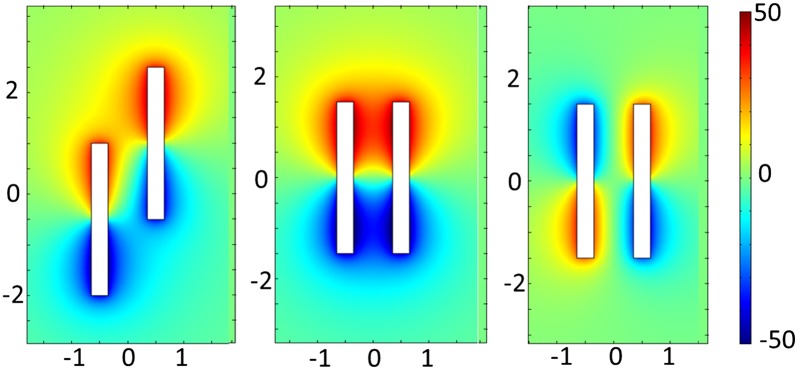
Fig. 2.

Numerical simulation of the electrostatic interactions between two nanomotors at different relative positions. Distances on both x and y axes in the images are shown in μm. These images are slices of the xz planes of 3D simulation results. Colors in the images represent the space charge density (C/m3), with red being positive and blue negative. Cartoons of Au–Pt nanomotors are superimposed over the simulation results for illustrative purposes, with coloring of the two segments of the rods.
