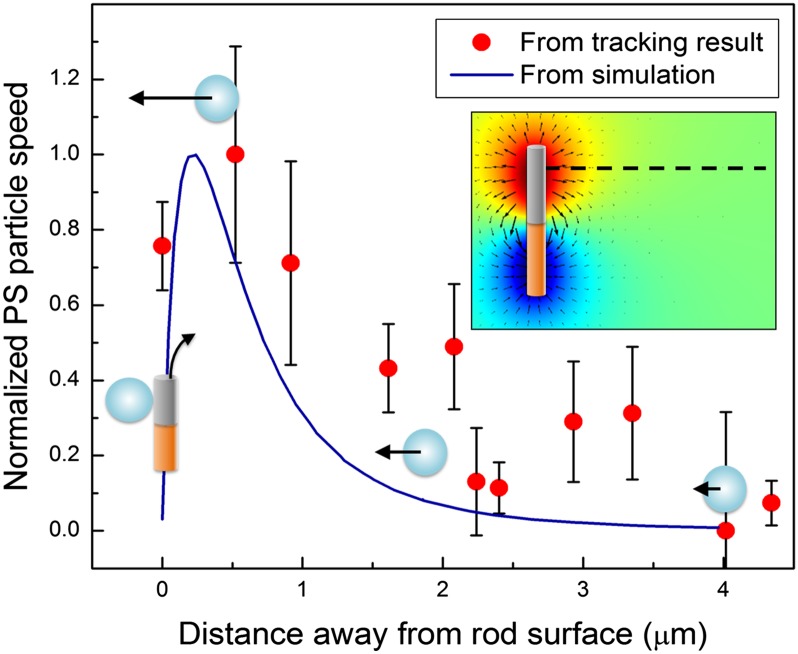
Fig. 5.
Electrophoretic speed of a tracer PS particle as it approaches the nanomotor. (Inset) Numerical simulation of the electric potential distribution around an Au–Pt nanomotor. Red and blue shading represents the electric potential, with red and blue being positive and negative, respectively. The arrows indicate the electric field vector. The electrophoretic speed of a PS particle with a zeta potential of –64 mV along the black dashed line is simulated and plotted as the blue curve (normalized to the peak speed). Red data points are from the tracking results of the first PS particle in Fig. S7 (and are normalized to the peak speed). The effect of Brownian motion was subtracted from the velocity profile of the tracking results.

