Fig. 4.
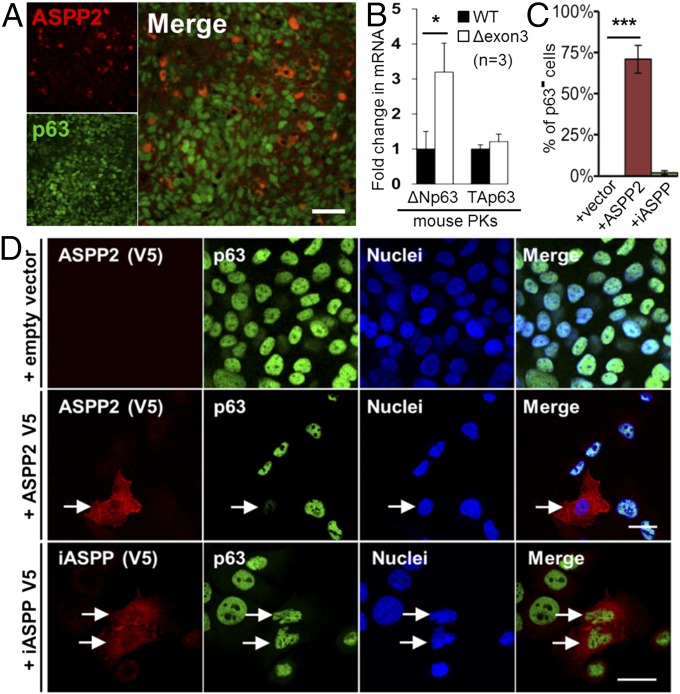
ASPP2 represses p63 expression in vivo and in vitro. (A) Double IF staining of ASPP2 and p63 in a tumor section derived from an ASPP2Δexon3/+ BALB/c mouse. (Scale bar: 20 µm.) (B) RT-qPCR expression analysis of ΔNp63 and TAp63 mRNA in mouse PKs (whole epidermis), with GAPDH mRNA as internal control. (*P = 0.034; n indicates the number of littermate-paired PKs used). Bar graph values are the mean ± SD from three different experiments. (C and D) Double IF staining of 040 cells to detect transfected ASPP2-V5 (red) or iASPP-V5 (red) and endogenous p63 (green). TO-PRO was used to visualize nuclei. ASPP2-V5+ and iASPP-V5+ cells are labeled with white arrows (D). The percentage of V5+/p63− cells in indicated transfected samples is shown in C (***P < 0.0001). Values are mean ± SD from three different experiments. (Scale bars: 10 µm.)

