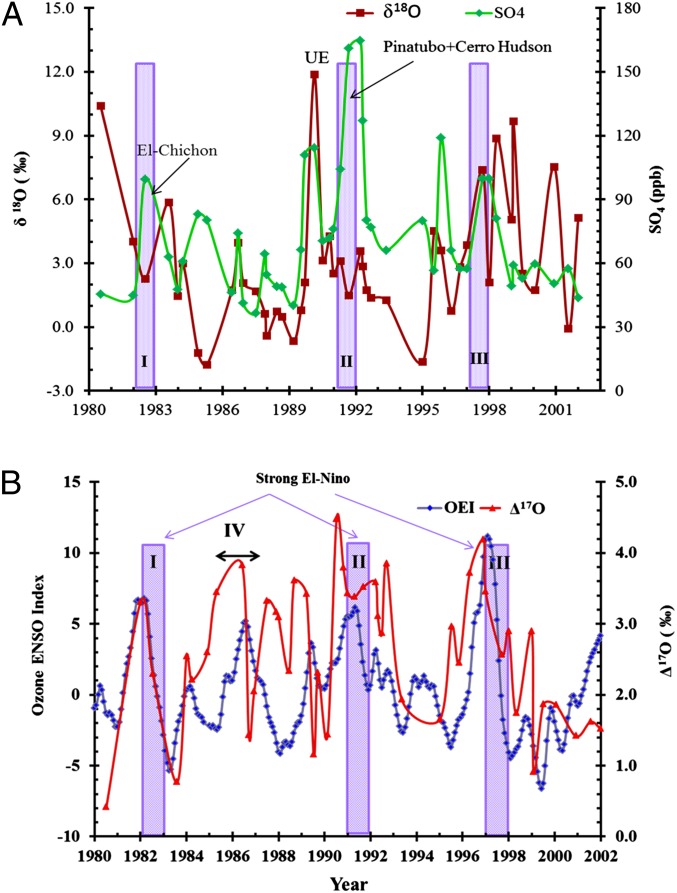
Fig. 1.
(A) Oxygen isotopic composition (brown squares) and sulfate concentration profile (green diamonds) of composite aerosol sulfate samples extracted from the snow pit (6 m high) at the South Pole, Antarctica. The increase in sulfate concentration due to El-Chichón and Pinatubo + Cerro Hudson is also shown. UE, unknown event. (B) Comparison of oxygen isotope anomaly (red lines) and OEI (blue lines) obtained by Ziemke et al. (65) from the deseasonalized trend in total O3 column measured at the equatorial Eastern and Western Pacific, an El-Niño region. Violet bars indicate three major ENSO events: ENSO-I (1982–1983), ENSO-II (1991–1992), and ENSO-III (1997–1998). A moderate event, ENSO-IV (1986–1987), is also shown. (The scale of ENSO events is defined by the National Oceanic and Atmospheric Administration and is available at www.cpc.noaa.gov/products/analysis_monitoring/ensostuff/ensoyears.shtml).

