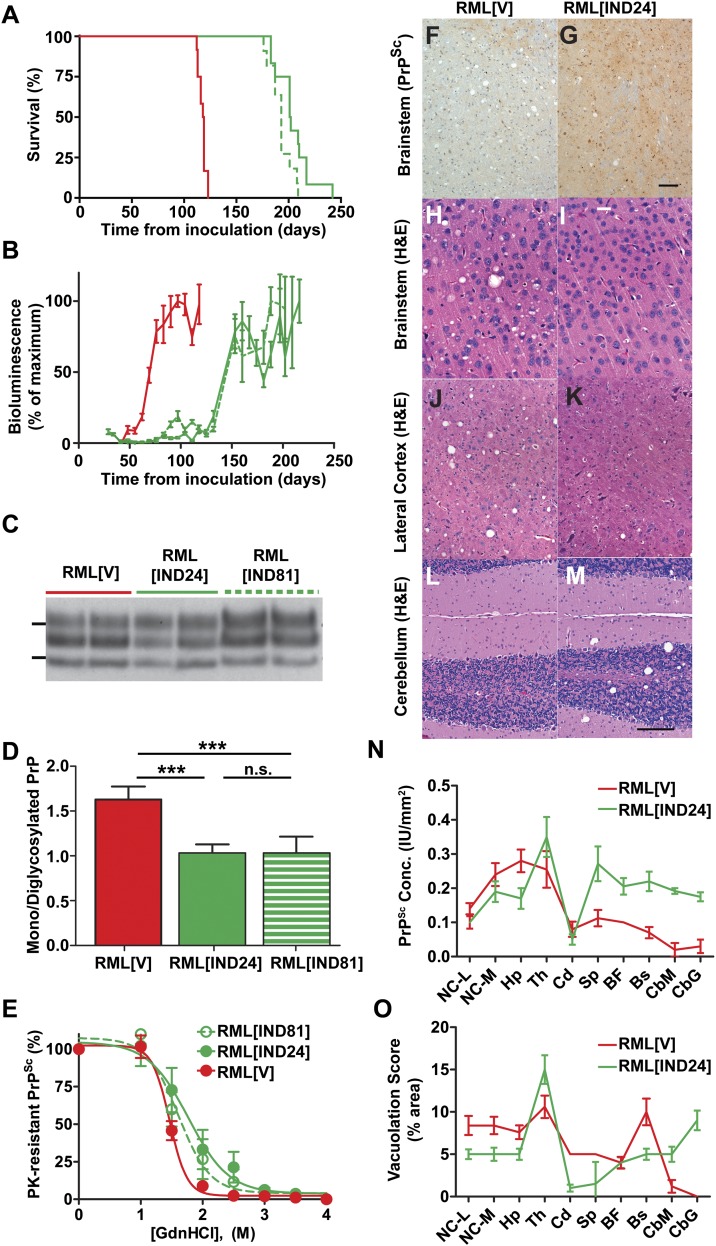
Fig. 2.
Effects of IND24 and IND81 treatment on RML-infected Tg(Gfap-luc)/FVB mice. (A) Kaplan–Meier survival curves for infected mice treated with vehicle (red; n = 12), IND24 (solid green; n = 12) or IND81 (dashed green; n = 11). This color scheme also applies to B–E and N–O. (B) Mean brain bioluminescence signal for mice in A, measured approximately every week; error bars represent SEM. (C) Immunoblot of PK-resistant PrP from the brains of terminal RML-infected mice treated with vehicle (RML[V]), IND24 (RML[IND24]) or IND81 (RML[IND81]). PrPSc was detected with HuM-P Fab conjugated to HRP. IND81-treated samples were loaded at 15× the protein level of other samples. Molecular weight markers of migrated protein standards represent 30 and 20 kDa. (D) Average ratio of monoglycosylated to diglycosylated PrPSc in mice treated with vehicle (n = 7), IND24 (n = 7), or IND81 (n = 9), as indicated. Error bars represent SD. ***P < 0.001, n.s., not significant, Student’s t test. (E) Conformational stability of prions from IND24-treated (n = 6), IND81-treated (n = 6), and vehicle-treated (n = 6) RML-infected mice. Samples were exposed to increasing concentrations of GdnHCl (0–4 M, as indicated) then subjected to PK digestion. Points represent average percentage of PK-resistant PrP remaining at each concentration of GdnHCl, and error bars represent SD. (F–M) Neuropathologic analysis of brain sections from RML[V] (Left) and RML[IND24] (Right) mice. (F and G) PrPSc immunohistochemistry of brainstem sections, stained using the R2 monoclonal antibody. (Scale bars in F and G: 100 μm.) (H–M) H&E stain of tissue sections from the brainstem (H and I), lateral cortex (J and K), and cerebellum (L and M). (Scale bars in H–M; 50 μm.) (N) Quantification of PrPSc deposition in multiple brain regions from RML-infected Tg(Gfap-luc)/FVB mice treated with IND24 (n = 12) or vehicle (n = 5), using the R2 monoclonal antibody. BF, basal forebrain; Bs, brainstem; CbG, cerebellum-granule cell layer; CbM, cerebellum-molecular cell layer; Cd, caudate nucleus; Hp, hippocampus; NC-L, neocortex-lateral; NC-M, neocortex-medial; Th, thalamus; Sp, septum. Error bars represent SEM. Measurements were made in intensity units (IU). (O) Quantification of vacuolation from multiple brain regions of mice treated with vehicle (n = 5) and IND24 (n = 14). Abbreviations as in N. Error bars represent SEM.

