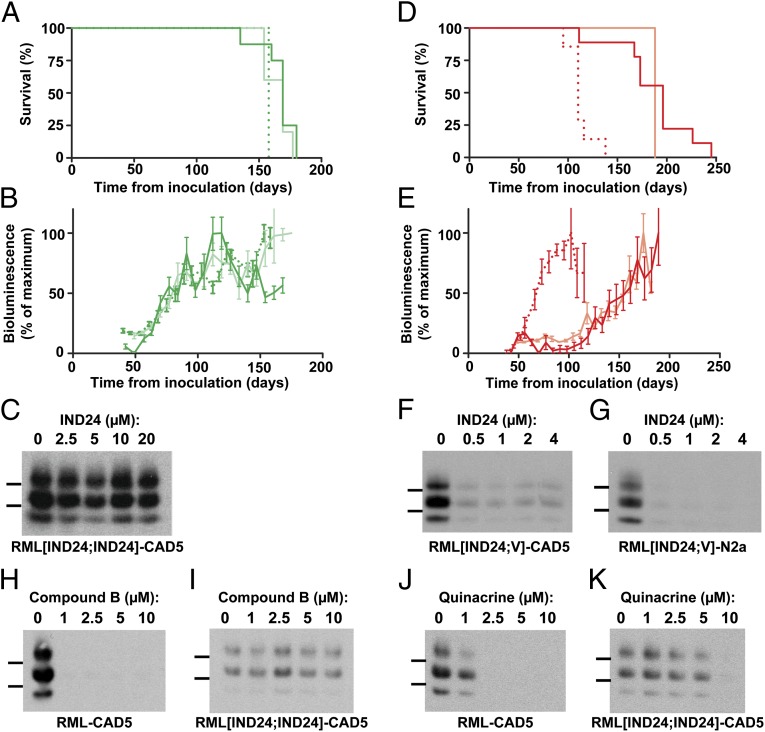
Fig. 4.
Serial passage of prions from IND24-treated mice. (A) Kaplan–Meier survival curves for passage of RML[IND24] and RML[IND24;IND24] into Tg(Gfap-luc)/FVB mice treated with IND24. Mice were inoculated with either RML[IND24] (green, n = 8; and light green, n = 5) or RML[IND24;IND24] (dotted green, n = 5). (B) Mean brain bioluminescence signal for mice in A, measured approximately every week; error bars represent SEM. Color scheme as in A. (C) PK-resistant PrPSc in CAD5 cells infected with RML[IND24;IND24] treated with 0–20 µM IND24, as indicated. PrPSc was assayed by immunoblot using HRP-conjugated HuM-D13 Fab. Images are representative of three replicates. Molecular weight markers of migrated protein standards represent 30 and 20 kDa. (D) Kaplan–Meier survival curves for passage of RML[IND24] or RML[IND24;V] into Tg(Gfap-luc)/FVB mice treated with vehicle. Mice were inoculated with either RML[IND24] (red, n = 8; and light red, n = 3) or RML[IND24;V] (dotted red, n = 7). (E) Mean brain bioluminescence signal for mice in D, measured approximately every week; error bars represent SEM. Color scheme as in D. (F–K) PK-resistant PrPSc in CAD5 cells (F) and N2a cells (G) infected with RML[IND24;V] then treated with 0–4 µM IND24, as indicated. (H–K) PK-resistant PrPSc in CAD5 cells infected with RML (H and J) and RML[IND24;IND24] (I and K) treated with 0–10 µM Compound B (H and I) or quinacrine (J and K). In F–K, PrPSc was assayed by immunoblot using HRP-conjugated HuM-D13 Fab. Images are representative of three replicates. Molecular weight markers of migrated protein standards represent 30 and 20 kDa.

