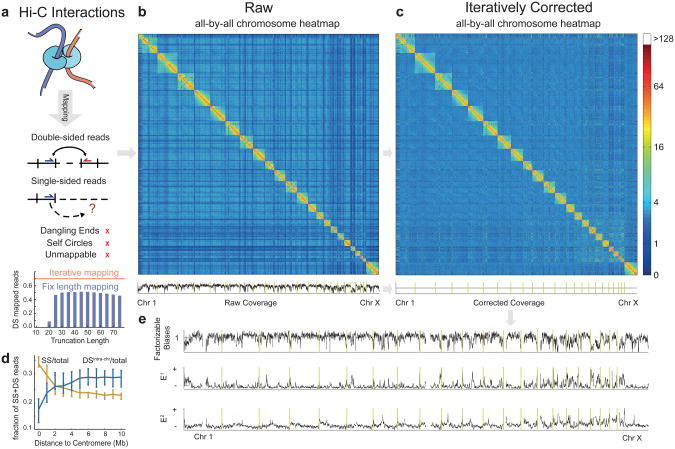
Figure 1. Pipeline for mapping, filtering, and iterative correction of Hi-C reads.
(a) Interacting chromatin regions are sequenced and reads are mapped to the genome using iterative mapping. Only the depicted double-sided reads (DS), or single-sided reads (SS) are retained. Bars show the fraction of DS reads mapped by truncation to fixed length, red line shows result of iterative mapping.(b, c) Raw and iteratively corrected whole-genome Hi-C maps binned at 1Mb resolution (filtered-out megabases are not shown). Coverage profile is the sum of each column in the map. Vertical yellow lines show chromosome boundaries. Note that after iterative correction the coverage profile is uniform. (d) Fractions of SS and DS intra-chromosomal reads as a function of centromeric distance, plotted at 1 Mb resolution for distances up to 10 Mb from each centromere; lines represent mean values and vertical bars represent 25th and 75th percentiles](e) Factorizable biases and eigenvectors (E1 and E2) obtained by ICE (at 1Mb resolution). Regions that do not pass filters (see Online Methods) or contain no mapped reads are shown as gaps. Vertical yellow lines show boundaries of chromosomes.

