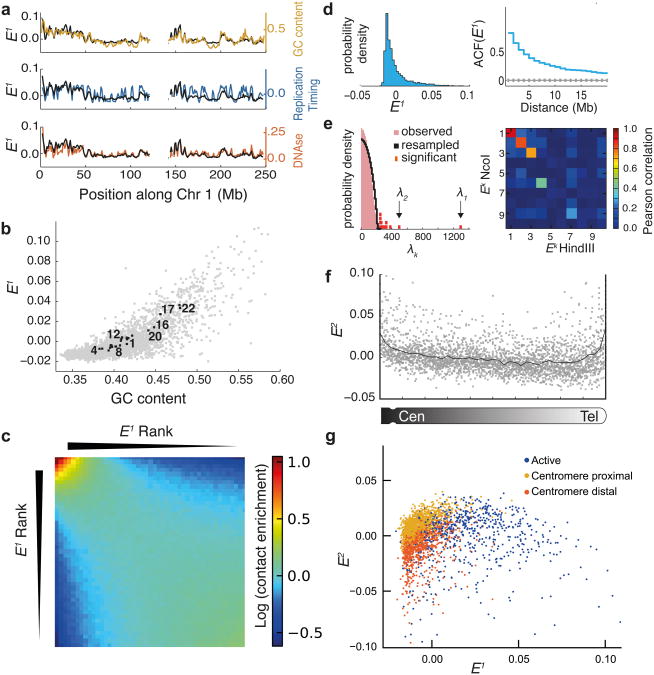
Figure 3. Eigenvector decomposition of iteratively corrected Hi-C data reveals genome-wide features of chromosome organization.
(a) Profiles of E1 and genomic features along chr1 (1Mb resolution), E1 from Hi-C HindIII data8(b) Scatter plot of E1 vs GC content. Gray dots show GC content and E1 of individual 1Mb regions. Black squares show mean chromosomal values of E1 and mean GC content. Several chromosomes are indicated by numbers. (c) Heatmap of inter-chromosomal contacts between pairs of genomic regions as a function of their E1 values; heatmap shows natural log of contact enrichment (see Online Methods). Notice the tendency of regions with similar values of E1 to interact with each other. (d) (Left) Distribution of E1 values. (Right) Autocorrelation of E1 (blue) compared to 1000 shuffled E1 (gray line shows mean, errorbars show standard deviation). (e) (Left) Distribution of observed eigenvalues (λk) and the distribution of eigenvalues for randomly re-sampled data (see Online Methods). Thirteen significant eigenvalues are shown in red. (Right) Matrix of Pearson correlation coefficients of leading eigenvectors obtained for Ncol and HindIII Hi-C data, revealing robustness of top three eigenvectors. (f) Variation of E2 along chromosomal arms, with higher values near centromeres and telomeres. Grey points show values for individual genomic regions, black line shows the mean. (g) Genome-wide inter-chromosomal interactions mapped onto E1 and E2 space at 1Mb resolution. Regions are colored according to previously proposed17 chromatin types17. Notice no 17evident separation into distinct clusters. E1 and E2 calculated for Hi-C HindIII dataset8.

