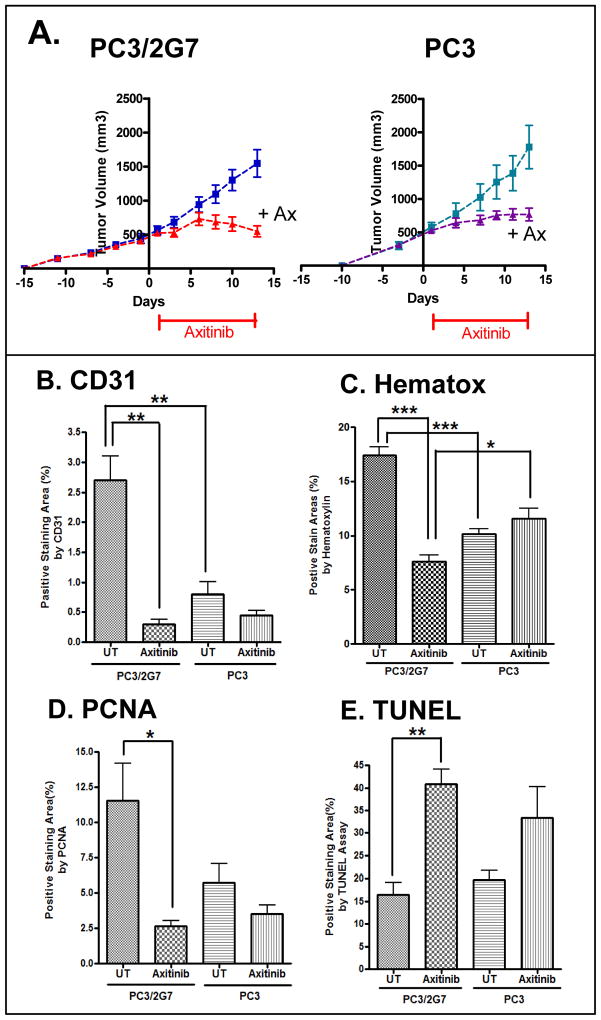
Figure 2. Anti-tumor activity of axitinib against PC3/2G7 and PC3 tumors.
A. Effect of daily axitininb treatment (days 1–12) on tumor growth in male scid mice. Tumor volumes, mean ± SE, for n=10–14 tumor/group. B–E, Quantitative analysis of the effects of axitinib on: B, tumor microvessel density (CD31 staining); C, tumor cellularity (hematoxylin staining); D, tumor cell proliferation (PCNA staining); and E, apoptosis (TUNEL). Quantitation was determined using ImageJ. Data are mean ± SE values based on stained cryosections (magnification, 4.2×) from three different regions of n = 4 tumors/group. Representative stained images are shown in Supplemental Fig. 2. * p<0.05, ** p<0.01, *** p<0.001 by two-way ANOVA (A), or by two-tailed student’s t-test (B–E).

