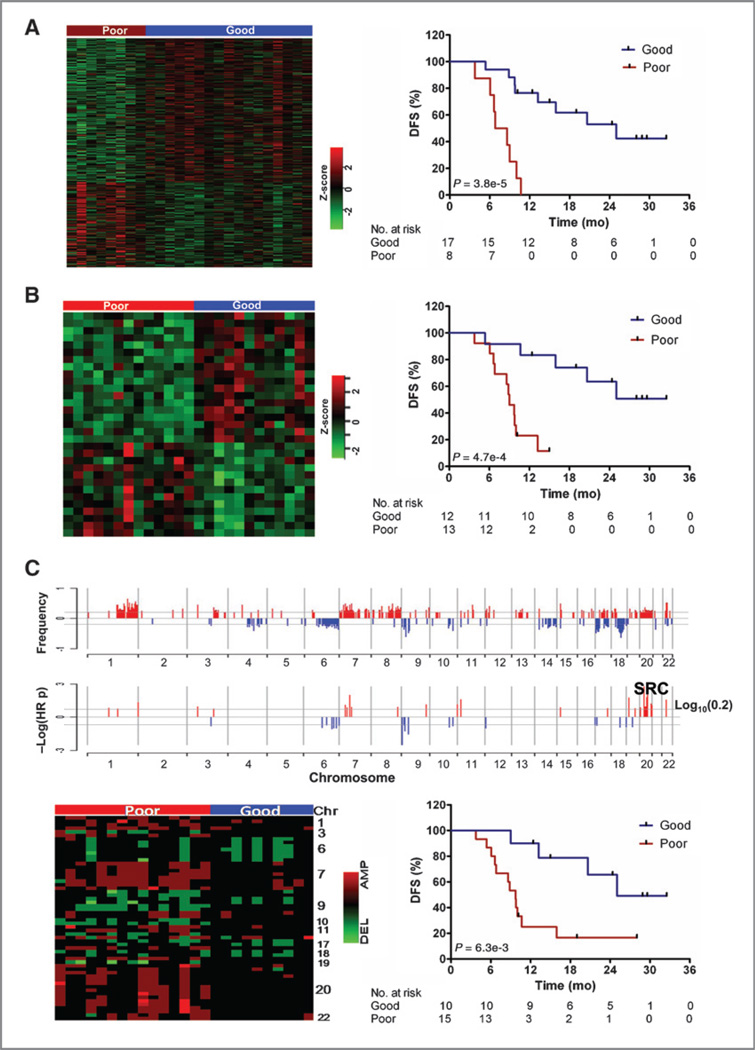
Figure 1.
Independent mRNA, miRNA, and SNP array analyses reveal signature sets predicting prognosis. Heat map and Kaplan–Meier (KM) survival curves of stratified subgroups based on mRNA expression of 500 transcripts (A) and 31 miRNA with highest absolute Cox scores (B). C, genomic location of high (>20% of patients) frequency CNAs (top) and the subset also associated with prognosis (HR P < 0.2; bottom). Heat map and survival curves for subgroups defined by an unsupervised clustering approach of signature CNAs (encoding 68 genes) using Ward's method for agglomeration and Manhattan function for distance metric.

