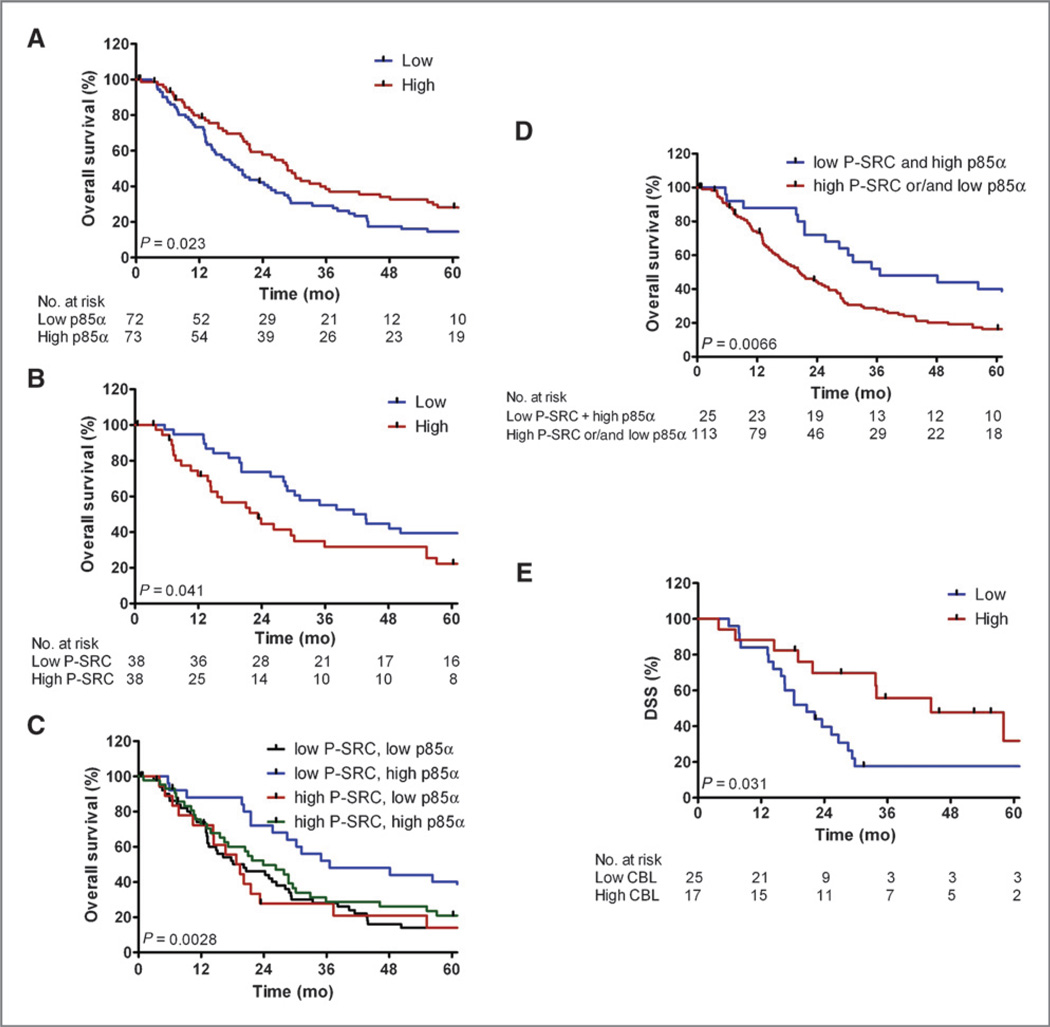
Figure 5.
p85α and P-SRC expression predicts PDAC survival in independent validation cohorts. Kaplan–Meier (KM) curves for dichotomized groups of low (blue) versus high (red) IHC expression on the TMA for p85α in the full cohort (A) or P-SRC for tumors of low grade histology (B). KM curves are also shown for various combinations of both markers (C) or the single group with combined low P-SRC and high p85α versus all other combinations (D). E, KM curves of dichotomized low (blue) versus high (red) CBL mRNA expression in a separate qPCR validation cohort of 42 resected PDAC samples.

