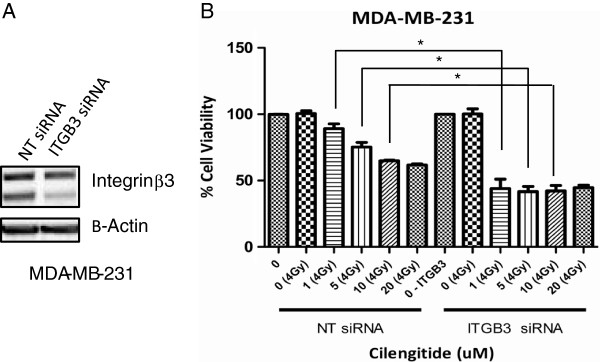
Figure 7.

MTS proliferation assay following ITGB3 knockdown in MDA-MB-231 cells. Cells were treated with 25nM siRNA (either NT or ITGB3) for 48 hours before being treated in the same manner as described in Figure 5. A) Target knockdown was confirmed via western blot. B) Cells treated with NT siRNA showed a similar pattern to previous results, while cells treated with ITGB3 siRNA showed a pronounced radiosensitization in combination with cilengitide treatment. NT untreated controls and ITGB3 untreated controls were used for normalization within their respective groups. The ratio of ITGB3 knockdown/NT treated cell viability cell viability at 96 hours is 0.935. Figures show Mean ± SEM and represent the average of three experiments. * = ≤ 0.05.
