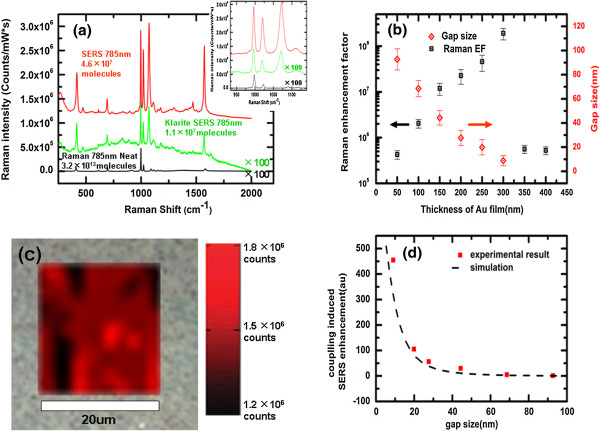
Figure 3.

Comparison of substrates and neat benzene thiol, average EFs and gap sizes, spatial mapping, and COMSOL simulations. (a) Comparison of the SERS of substrates CW300 (red), Klarite® (green), and neat Raman spectra (black) of benzene thiol collected at 785-nm incident. The number of molecules of benzene thiol that each measurement is probing is denoted in the figure. Inset: zoomed-in region of the spectra showing the three primary modes located near 1,000/cm, with the 998/cm used for calculation of the SERS enhancement factor. Note that the SERS of the Klarite® substrate and the neat spectra have been multiplied by a factor of 100 for easier direct comparison. (b) Average EFs (black open squares) and gap sizes between neighboring nanopillars (red open rhombuses) as function of gold film thickness deposited on the cicada wing. (c) Spatial mapping of the SERS intensity at 998/cm of SERS substrate CW300 over an area larger than 20 μm × 20 μm. The background is the optical reflection image of substrate CW300 photographed through a microscope with a × 50 objective. (d) COMSOL simulations of SERS enhancement (black dash) and the mean of experimental average EFs (red squares) as function of gap size between neighboring nanopillars. All date points are normalized to the corresponding value of SERS enhancement of CW50.
