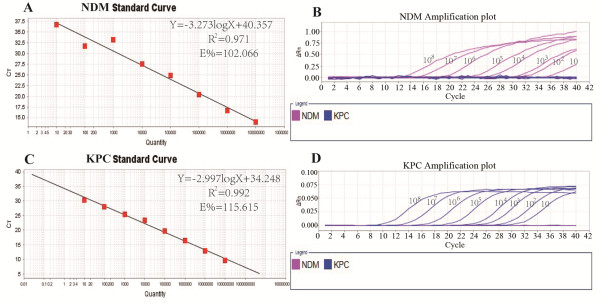
Figure 1.

Duplex real-time PCR 10-fold dilution series. E: Efficiency; R2: coefficient of determination. Standard curves (Ct plotted against the log of the starting quantity of template for each dilution) and amplification curves of the dilution series for (A, B)blaNDM and (C, D)blaKPC.
