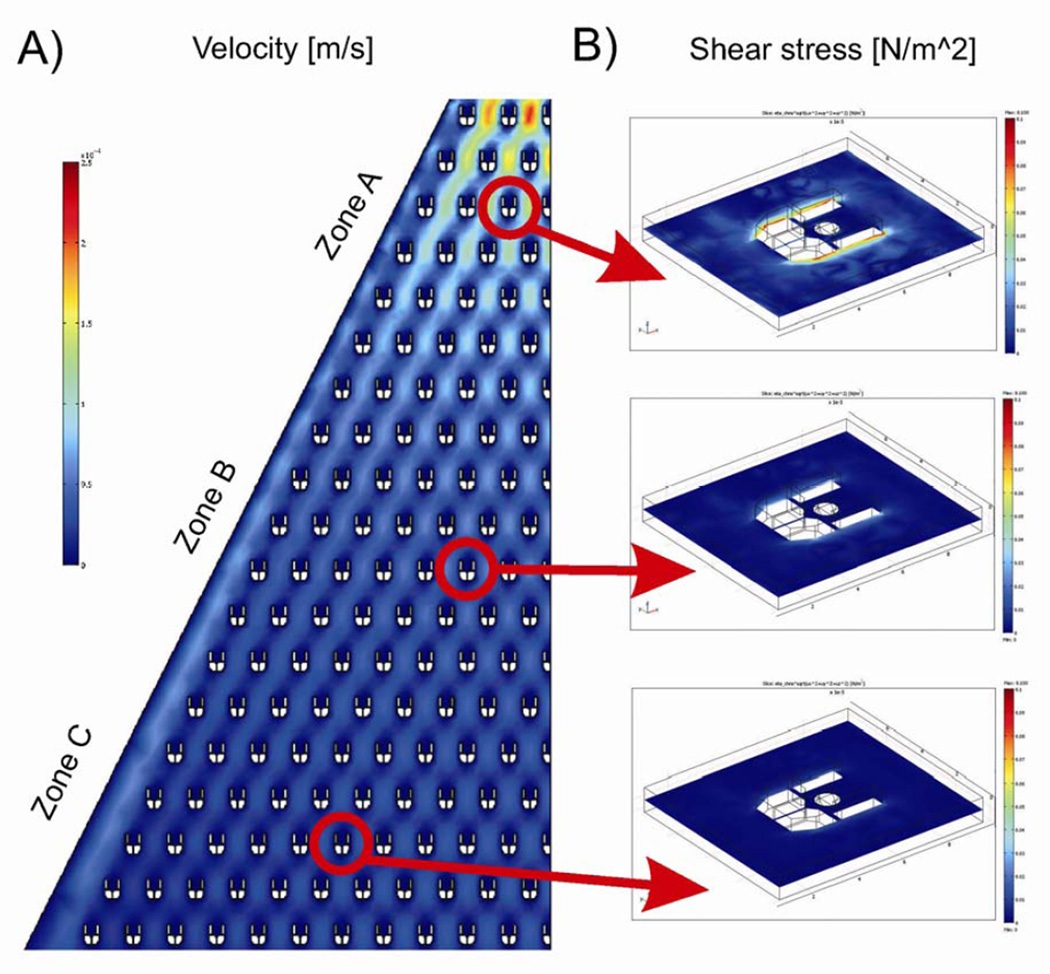
Figure 2.
Computational modelling of hydrodynamic conditions inside microculture chamber. A) A 2D computer model of the flow velocity. Because of the shape of the overall device, the fluid flow velocity decreases nonlinearly towards the outlet with a substantial drop after first ten rows of traps. In all cases, the regions inside the traps are characterized by a velocity field much lower than in the remaining area of the microchamber. B) 3D simulation results of the shear stress exerted on a trapped cell in three sections of the chip: high velocity (zone A), medium velocity (zone B) and low velocity (zone C). All scale bars have been set to the same limits.

