Figure 3.
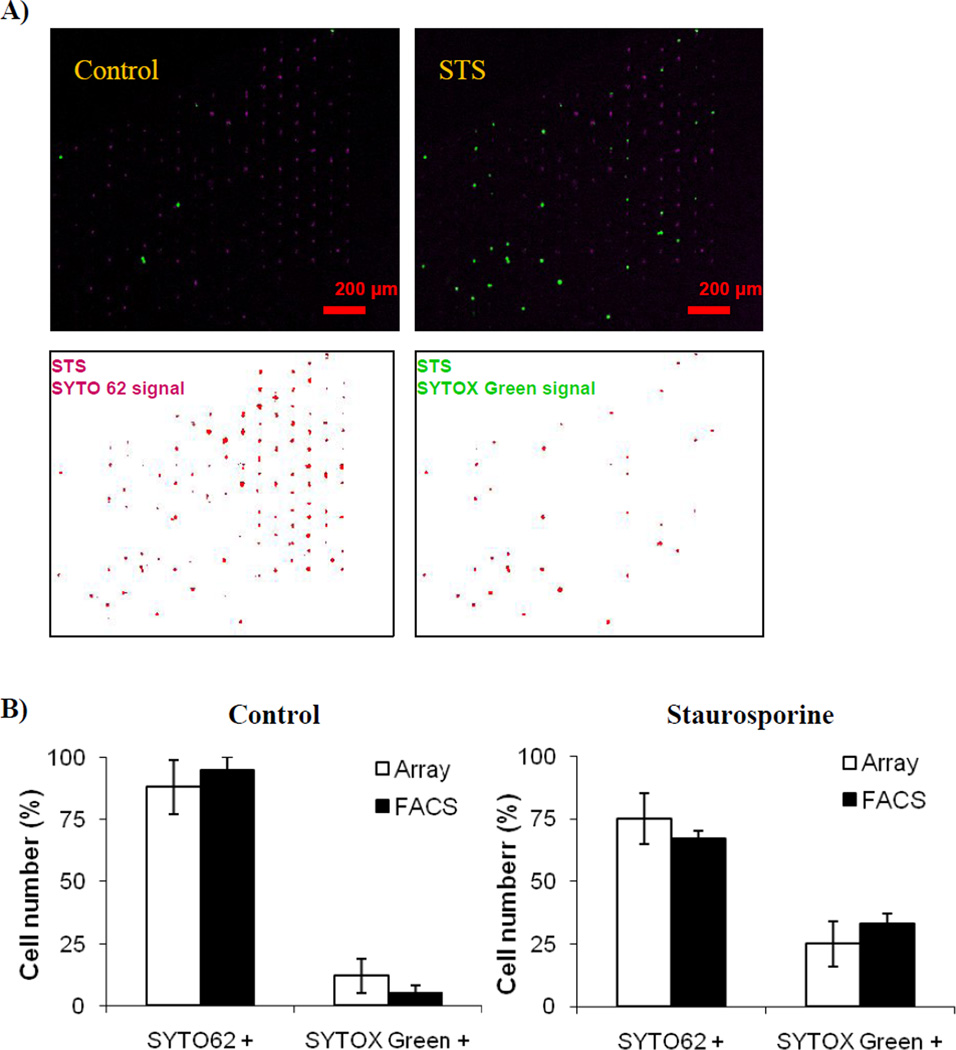
On-chip analysis of drug induced apoptosis. Human HL-60 cells were perfused with 2 µM of Staurosporine (STS) for 2 hours in the presence of apoptosis marker SYTO 62 and plasma membrane permeability marker SYTOX Green. A) On-chip quantification of apoptosis using SYTO 62 and SYTOX Green. Composite images were collected at time 0 and 2 hours (upper panels). Automated chip analysis for STS treated samples is shown in lower panels. B) Quantification and comparison of data obtained by array chip and conventional flow cytometer. Parallel samples were separately analyzed using either conventional flow cytometer (BD FACS Calibur, BD Biosciences) or microfluidic cell array. Note excellent correlation between results from these two technologically dissimilar platforms (R2 ≥ 0.85; p < 0.05 for Pearson and Lee linear correlation test).

