
Figure 9. .
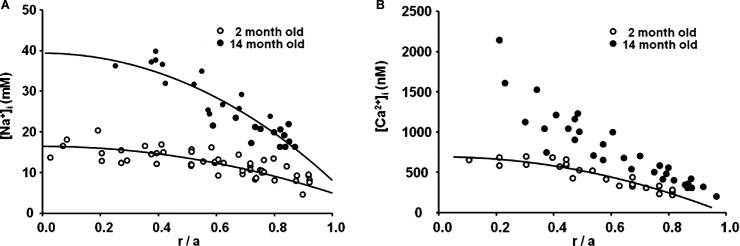
The effects of age on intracellular ion concentrations. (A) The intracellular sodium concentration graphed as a function of fractional distance from the lens center. At age 14 months, there is a much larger center to surface concentration gradient than at 2 months, due in part to the larger size and lower gap junction coupling conductance, but moderated by the reduced sodium influx. Both data sets are well fit by parabolic curves that indicate there is a continuous circulation of sodium between the center and surface of the lens. (B) The intracellular calcium concentration graphed as a function of fractional distance from the lens center. At age 14 months, there is a much larger center to surface concentration gradient than at 2 months. The data at age 2 months are well fit by a parabolic curve, which is based on a circulation of calcium between the lens center and surface. However, at age 14 months, the data no longer fall along such a curve, suggesting calcium influx across fiber cell membrane exceeds the rate of flow to the lens surface so there is uncontrolled accumulation in central fiber cells.