
Fig. 5.
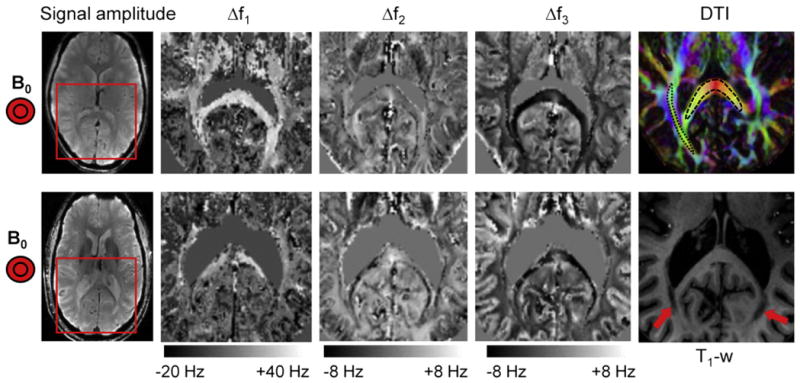
Multi-component relaxation in human brain. Multi-component fitting was performed on normal (top row) and MS brain (bottom row) in regions indicated by the red rectangle on the leftmost images (Signal amplitude at TE = 20 ms). As in marmoset brain, distinct frequency distributions are observed for the three components. The most notable differences seen in the MS brain are a strong reduction in Δf1 (assigned to myelin water) in the major fiber bundles and in areas of major lesions (indicated with arrows on the T1-weighted image). The complete set of fitted parameters for both subjects is provided in Fig. A.3. DTI (top right) shows fiber orientations and areas in the splenium of corpus callosum (black dashed line) and optic radiations (black dotted line) used for ROI-based fitting (Table 1).