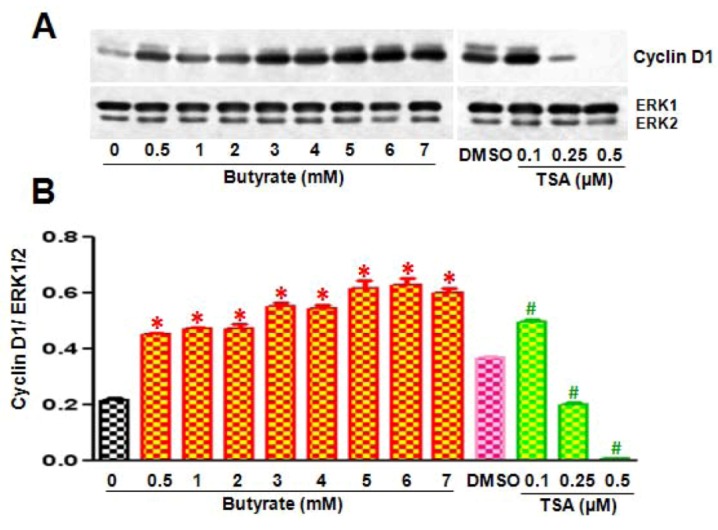
Figure 3.

Disparate effects of butyrate and TSA on cyclin D1 expression in VSMC. Proliferating VSMC were treated with different concentrations of butyrate or TSA for 48 h and then cell lysates were prepared and processed for western analysis of cyclin D1. (A) Western blots were probed with cyclin D1-specific antibody and band intensities of cyclin D1 were determined and quantitated using a Molecular Imager FX Pro Plus MultiImager system and Quantity one software (Bio-Rad, CA, USA); (B) Band intensities are normalized to ERK1/2 as shown in bottom panel. Data are presented as mean ± S.D. of three independent experiments. * p < 0.0001 vs. no addition control (Con); # p < 0.0001 vs. DMSO vehicle control by ANOVA with the Bonferroni test.
