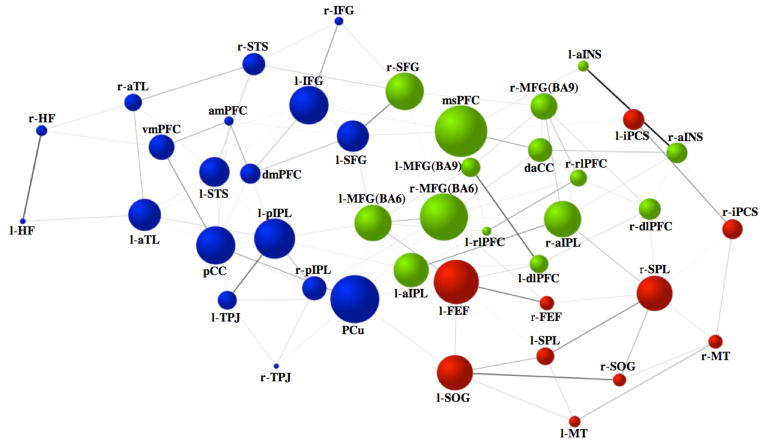
Figure 4.
Intrinsic direct connectivity graph within and between the default (blue), dorsal attention (red) and frontoparietal control (green) networks. Line-weights represent the magnitude of the partial correlation between nodes. Node size represents the magnitude of betweenness-centrality. Node color designates network membership determined by the cluster analysis of the full correlations. Prefixes l- = left hemisphere, r- = right hemisphere See Table 1 for abbreviations.

