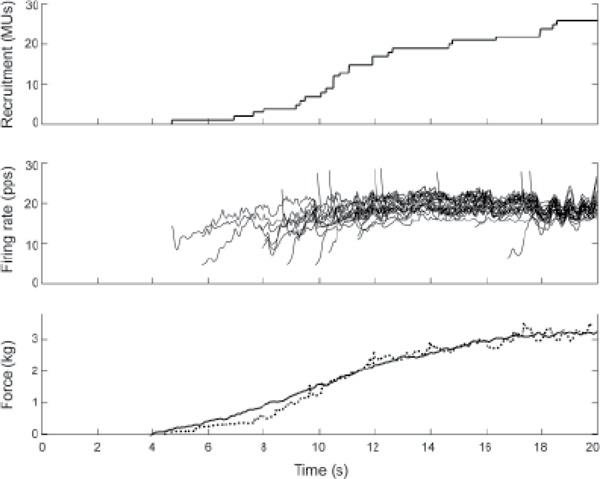
Figure 2. Ramp contraction of control subject C2. Top panel: Recruitment profile, showing the number of active motor units (MUs; across all recording sites) at each instant during the contraction. Middle panel: Instantaneous firing rates of each MU. Bottom panel: Contractile force (solid) and total activation (dotted). The total activation is the sum of the instantaneous firing rates of all the MUs that are active at each instant in time and thus represents the total neural drive to the muscle. The total activation has been scaled to match the force profile.

