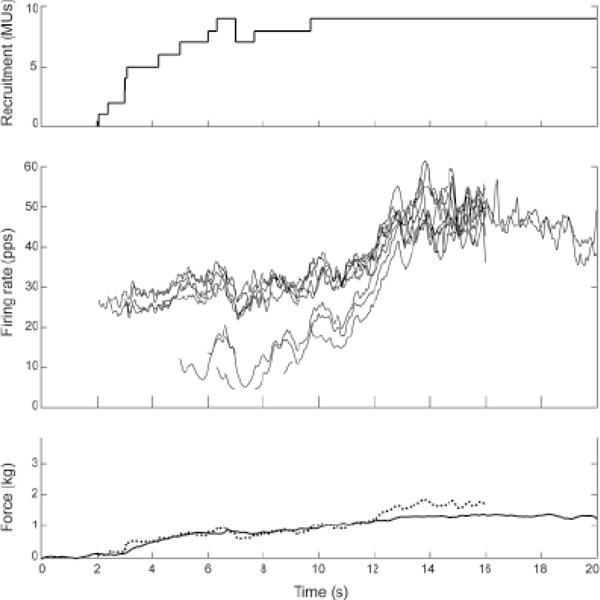
Figure 4. Ramp contraction of subject S2. The different traces are as described in Figure 2. The recruitment and firing rate profiles include all the motor units (MUs) detected in all 3 heads. Because of the high firing rates and motor unit action potential (MUAP) variability, it was only possible to decompose the full firing patterns of 2 MUs beyond 16 seconds, and so it was not possible to calculate the total activity after 16 seconds. The total activity has been scaled to match the force profile over the interval from 0 to 12 seconds. After that, the increase in total activity did not match the force.

