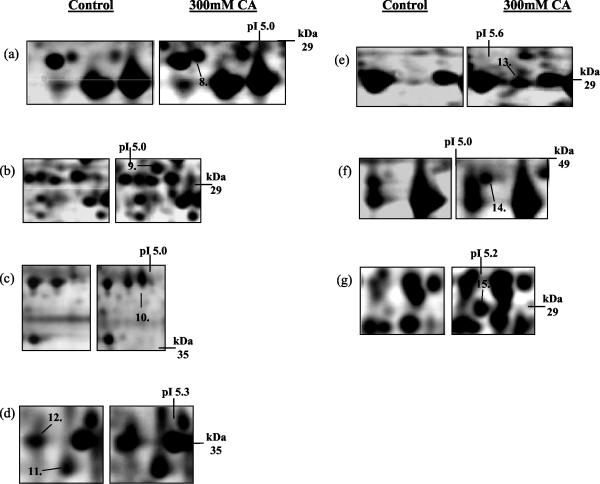
FIG. 3.
Identification of changes in protein expression induced in S. cerevisiae BY4741 due to growth in the presence of 300 mM citric acid, pH 3.5. Total soluble proteins were separated by IEF over the pH range 4 to 7. Proteins were prepared from control cells (grown in ME medium [pH 3.5]) and cells grown in ME medium (pH 3.5) plus 300 mM citric acid (CA). The positions of Ssa1p (protein 8), Vma4p (protein 9), Rps0ap (protein 10), Gpp1p (protein 11), Ipp1p (protein 12), Eno2p (protein 13), Ssb2p (protein 14), and Hsp26p (protein 15) are indicated. Molecular masses (in kilodaltons) are shown on the y axis, and pI values are shown on the x axis. A representative result of two replicate experiments is shown.

